Gå til hovedinnhold
Havforskningsinstituttet
HI
English
<- Tilbake
Søk
Søk
Søk
View page in English
Figur
Fra rapporten:
Survey report from the joint Norwegian/Russian Ecosystem Survey in the Barents Sea and the adjacent waters August-December 2022
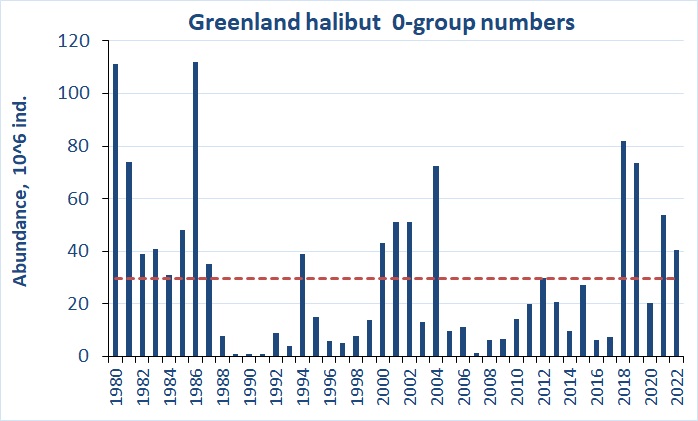
Figure 6.8.2. 0-group Greenland halibut abundance estimates were not corrected for capture efficiency for the period 1980-2022. Red line shows the long-term average.