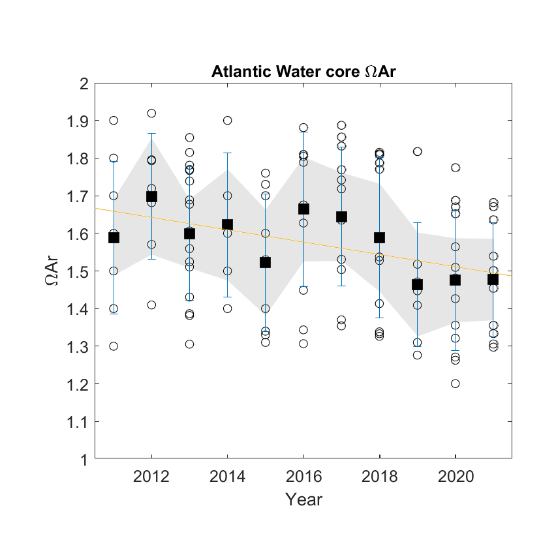
Fig.22: The time series of aragonite saturation (ΩAr) in the period 2011 to 2021 in the Atlantic Water (salinity ³ 34.9, temperature ³ 0°C, depth ³ 200 m) in the Norwegian Sea. The linear regression fit (orange line; gradient = - 0.0164 ± 0.0060, p = 0.0239, R2 = 0.45) is based on annual mean ΩAr values (black squares) from observational data (circles). Bars are ± 1 standard deviation for each annual mean. The grey shaded area represents the 95% confidence limits.