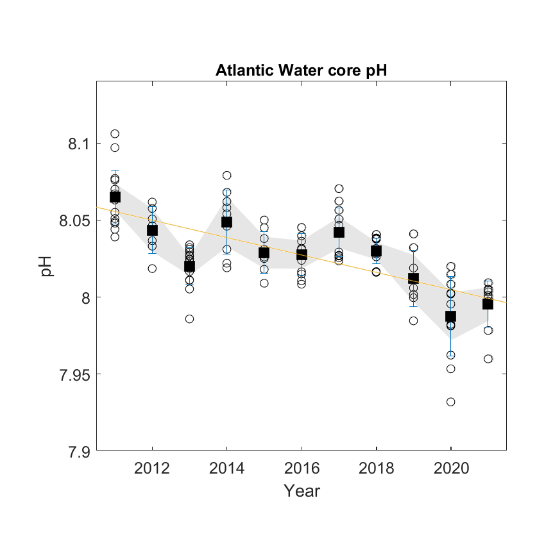
Fig.21: The time series of pH in the period 2011 to 2021 in the Atlantic Water (salinity 34.9, temperature 0, depth 200 m) in the Norwegian Sea. The linear regression fit (orange line; gradient = 0.0056 0.0013, p = 0.0022, R2 = 0.67) is based on annual mean pH values (black squares) from observational data (circles). Bars are 1 standard deviation for each annual mean. The grey shaded area represents the 95% confidence limits.