Gå til hovedinnhold
Havforskningsinstituttet
HI
English
<- Tilbake
Søk
Søk
Søk
View page in English
Figur
Fra rapporten:
Panel-based Assessment of Ecosystem Condition of the Norwegian Sea Pelagic Ecosystem
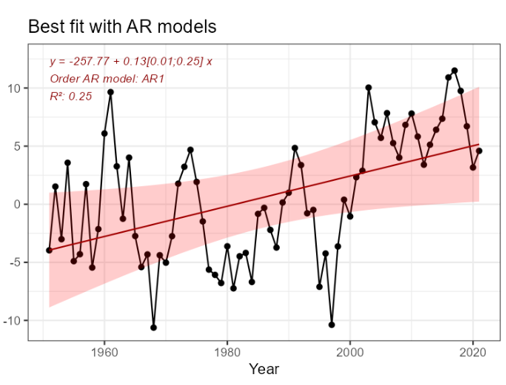
Figure 7.3.3. Estimated yearly means of heat content in the Norwegian Sea from 1951 to 2021. Linear trend fitted using a first order auto regressive model is indicated by the red line and equation with 95% CI shown in red.