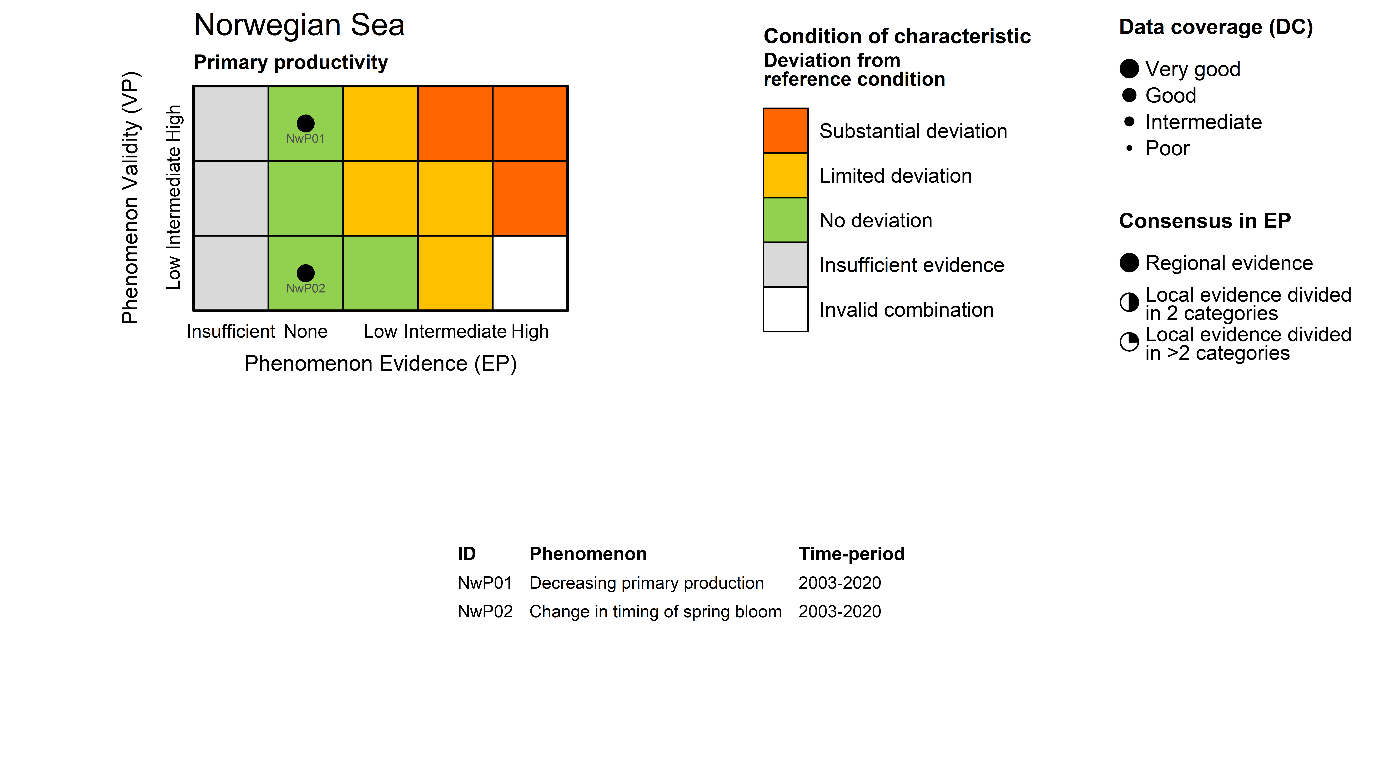
Figure 7.3.1 (i): The PAEC assessment diagram for the Primary productivity ecosystem characteristic of the Norwegian Sea. The table below list the indicators included in this ecosystem characteristic, their associated phenomenon, and the time period covered by the data used to assess the evidence for the phenomenon.