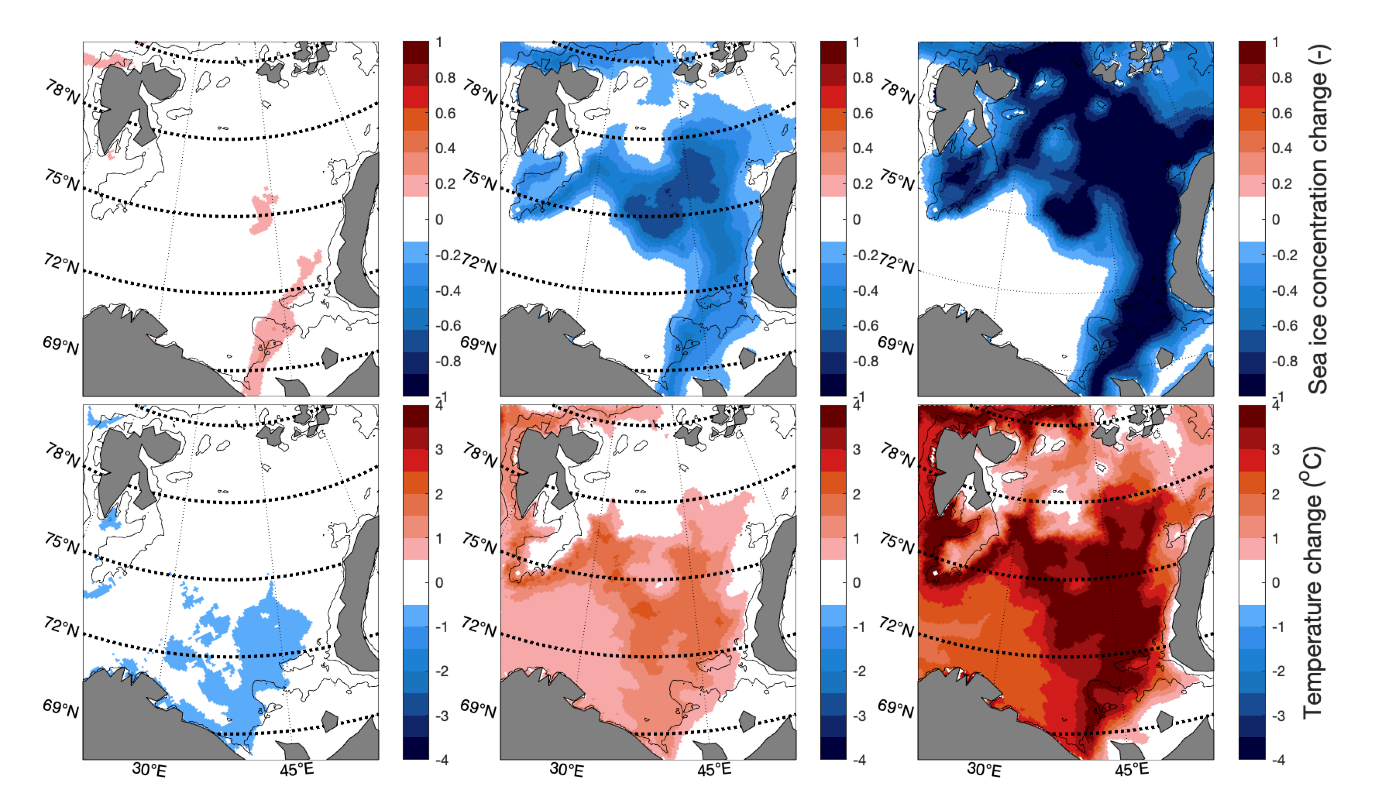
Figure 7.3.4 The upper row showing projected change in sea ice concentration from 2015 to the period 2081-2100 (shown as proprotional change of area with more than 15% ice cover from 2015 to an average for 2081-2100) under three different emission scenarios, SSP1-2.6 (left panel) SSP2-4.5 (middle panel) and SSP5-8.5 (right panel). The bottom row showing projected change in temperature from 2015 to 2100 for the same emission scenarios. Projections are downscaled from the model NorESM2 using the ocean model NEMO NAA10km. Source: Anne Britt Sandø, Institute of Marine Research, personal communication.