Gå til hovedinnhold
Havforskningsinstituttet
HI
English
<- Tilbake
Søk
Søk
Søk
View page in English
Figur
Fra rapporten:
Panel-based Assessment of Ecosystem Condition of Norwegian Barents Sea Shelf Ecosystems - Appendices
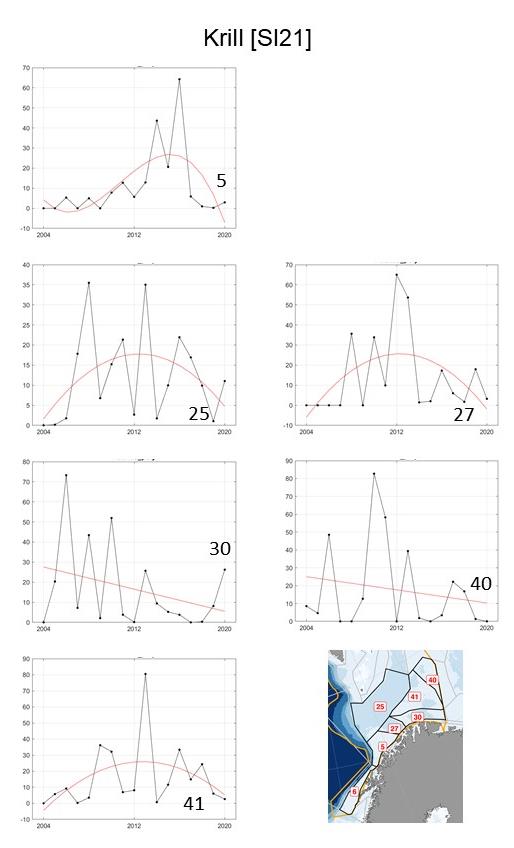
Figure S.21.4 Mean biomass of krill (kg wet wt. km-2) in each polygon in the subarctic part of the Barents Sea (number on top of each panel) with red line indicating rend fitted using the best fitted trend approach.