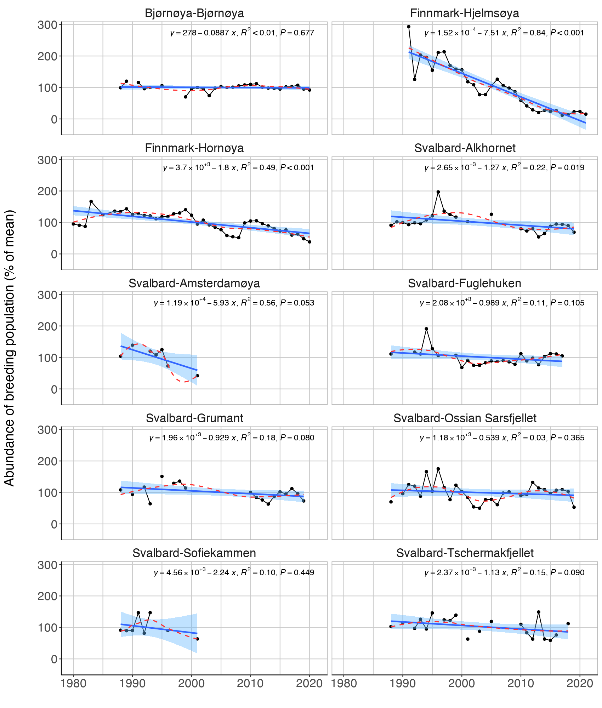
Figure A.9.3 Breeding population size of kittiwake (R. tridactyla) at a selection of colonies in Svalbard, Bear Island and Finnmark. Linear regression fit with 95% CI is shown in blue, and the statistical results are given in the top of each plot. A local smoother is added in red to assist visual interpretation of non-linear changes during the period.