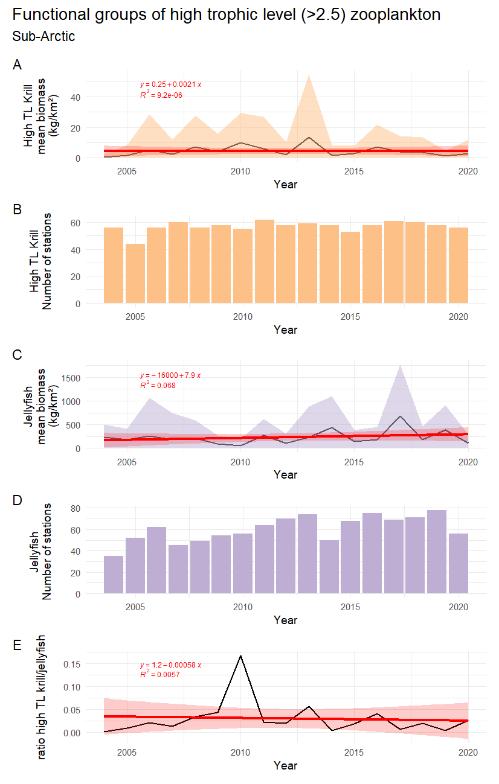
Figure S. 12.1 The time series of estimated mean biomass (kg wet wt. km-2) of high trophic level zooplankton A) pelagic high trophic level krill and C) gelatinous zooplankton shown with yellow (krill) and grey (jellyfish) shaded areas indicating ± 1 SD. Number of stations are indicated for krill (B) and small and medium mesozooplankton (D). E) Estimated ratio of biomass of pelagic carnivorous krill to biomass of gelatinous zooplankton. Red line and red shaded areas indicate fitted linear trend and 95% confidence band, with equation and R² indicated in red.