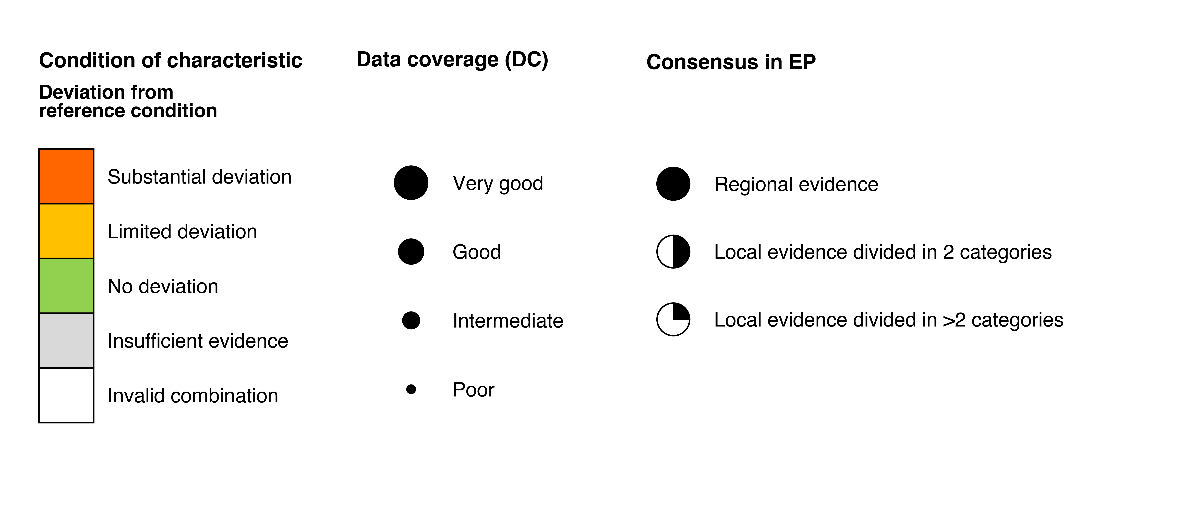
Figure Supp. 8.6.2. The PAEC assessment diagram for the Arctic part of the Barents Sea provides an overview of all phenomena for the ecosystem characteristic “Abiotic factors” limited to data at the temporal scale of biological data (2004-2020). Each dot represents the assessment of a phenomenon with ID (from Table 5.1a). The size of the dot indicates the data coverage (DC; larger symbols = better coverage, from Table 7.1a). The placement of the dot shows the value for the validity (VP) of the phenomenon and the levels of evidence (EP) for the phenomenon (from Table 7.2a). Note that phenomena which are scored as EP=Insufficient, should not be accounted for in the assessment, but are plotted to highlight phenomena for which data coverage and/or quality should be improved for future assessments. Bold lines around the coloured boxes, within the diagrams for each of the ecosystem characteristics, indicate the condition of the respective characteristic.