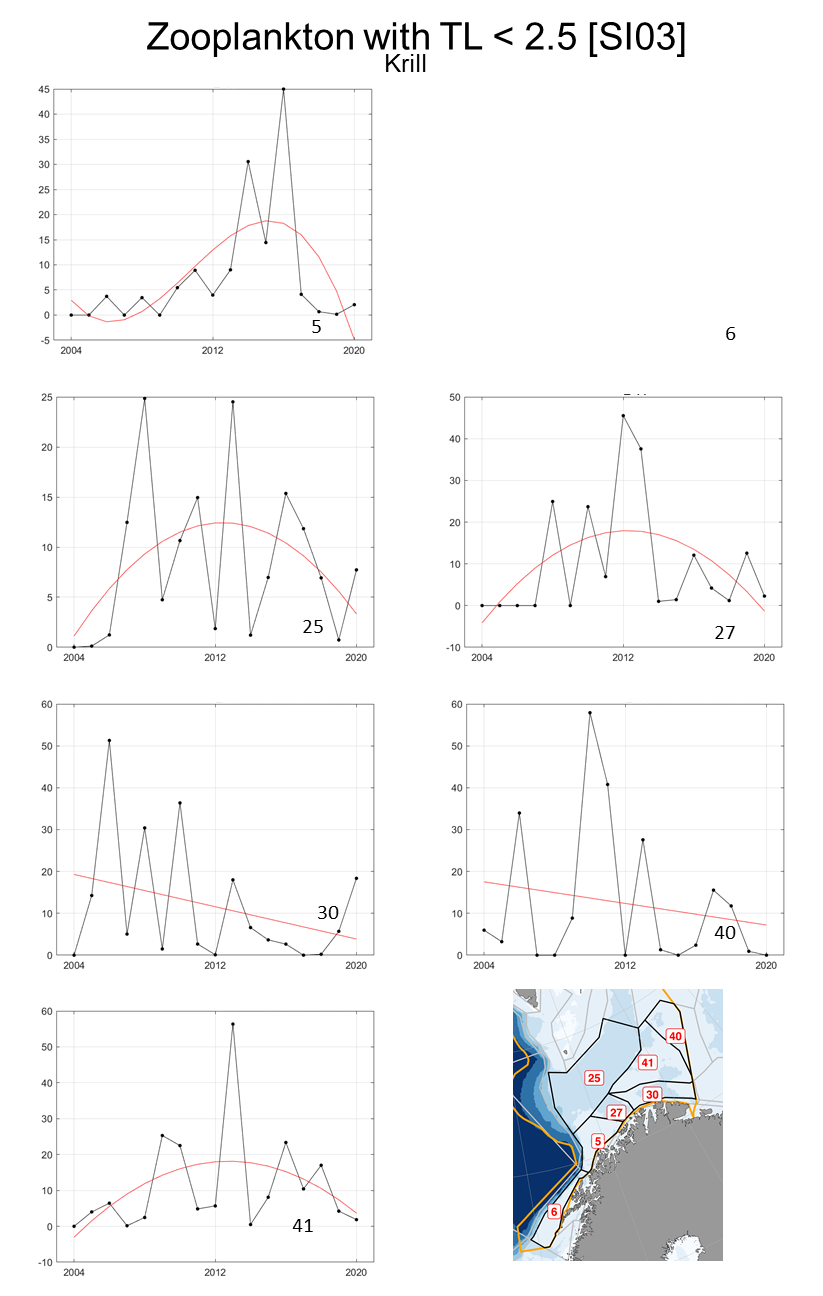
Figure S.3.4 Mean biomass of low trophic level krill (kg wet wt. km-2) in each polygon in the Subarctic part of the Barents Sea (number on top of each panel) shown with fitted trends estimated using the best fitted trend approach represented by the red line.