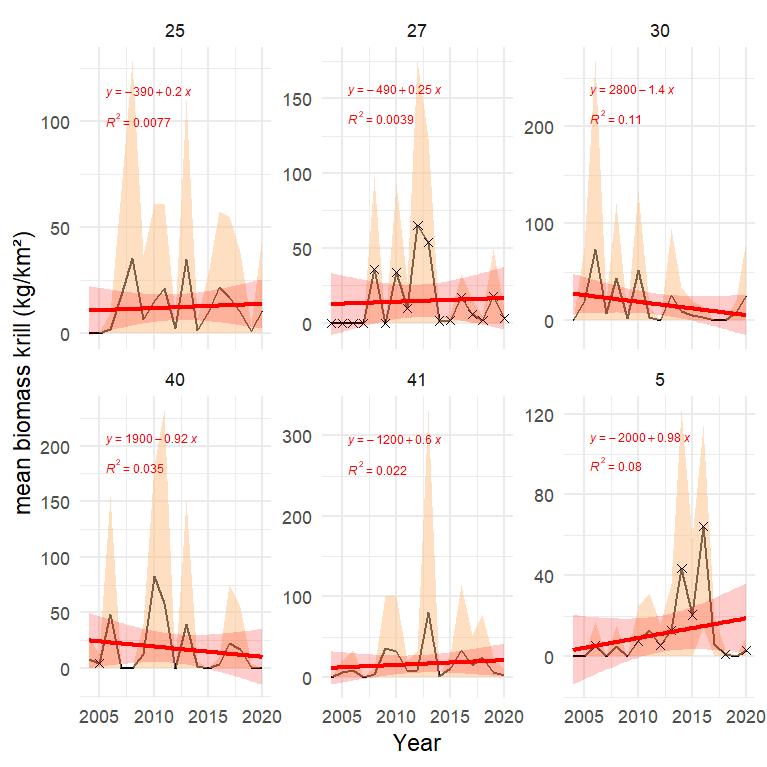
Figure S.21.3 Mean biomass of krill (kg wet wt. km-2) in each polygon in the subarctic part of the Barents Sea (number on top of each panel) with light shaded area indicating ± 1 SD. Red line and red shaded areas indicate fitted linear trend and 95% confidence band, with equation and R² indicated in red. Stars denote years with low sample size (< 5 trawls).