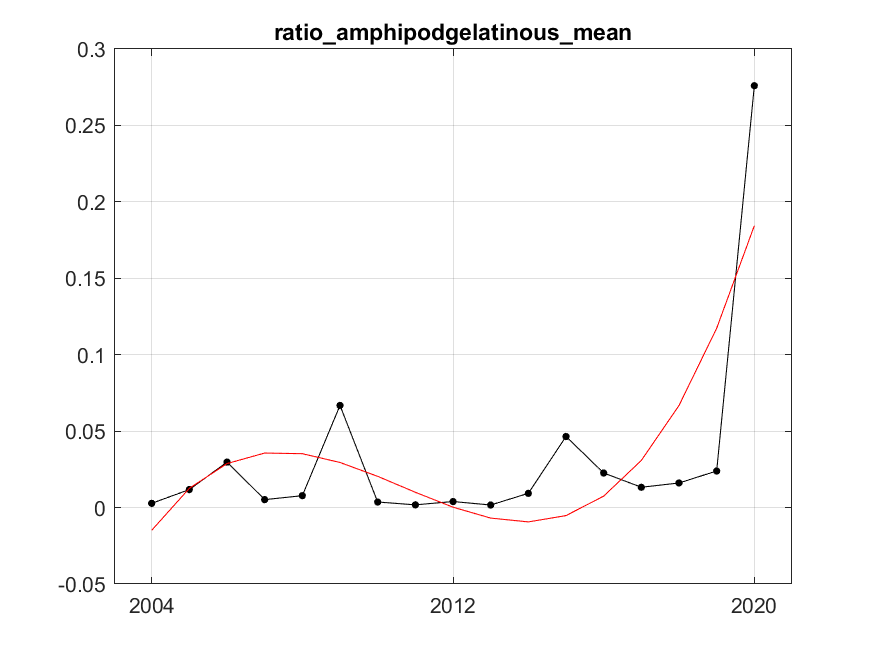
Figure A.13.2 Estimated ratio of biomass of pelagic amphipods (kg/km² wet wt.) to biomass of gelatinous zooplankton (kg/km² wet wt.) and fitted trend represented estimated by the best fitted trend approach by the red line. The fitted trend is of degree 3 (cubic) with R²=0.60. Residual variance after fitting was 0.001.