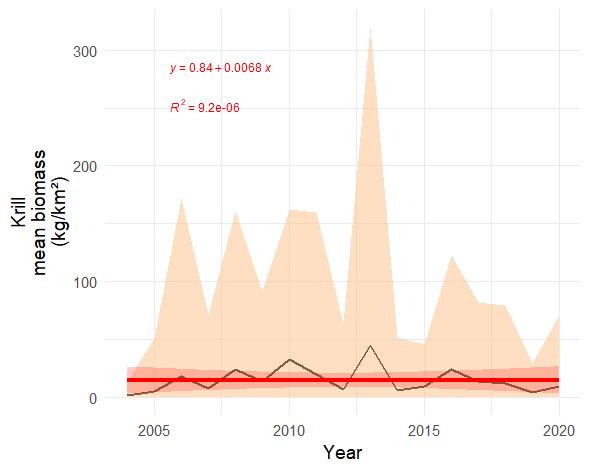
Figure S. 21.1. The time series of estimated biomass of krill (kg wet wt. km-2) shown with light shaded areas indicating ± 1 SD. Red line and red shaded areas indicate fitted linear trend and 95% confidence band, with equation and R² indicated in red.