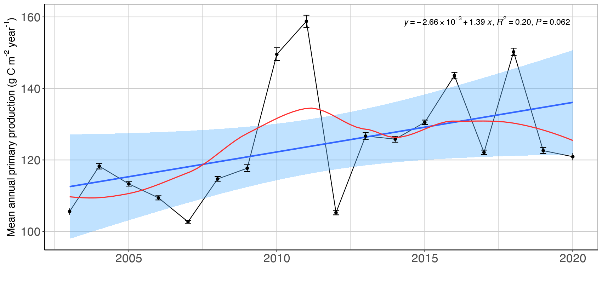
Figure A.1.1 The time series of estimated annual primary production in the Arctic part of the Barents Sea. Blue line and shaded areas indicate fitted linear trend and 95% confidence bands, with equation and R² indicated in black. Red line indicates smoother.