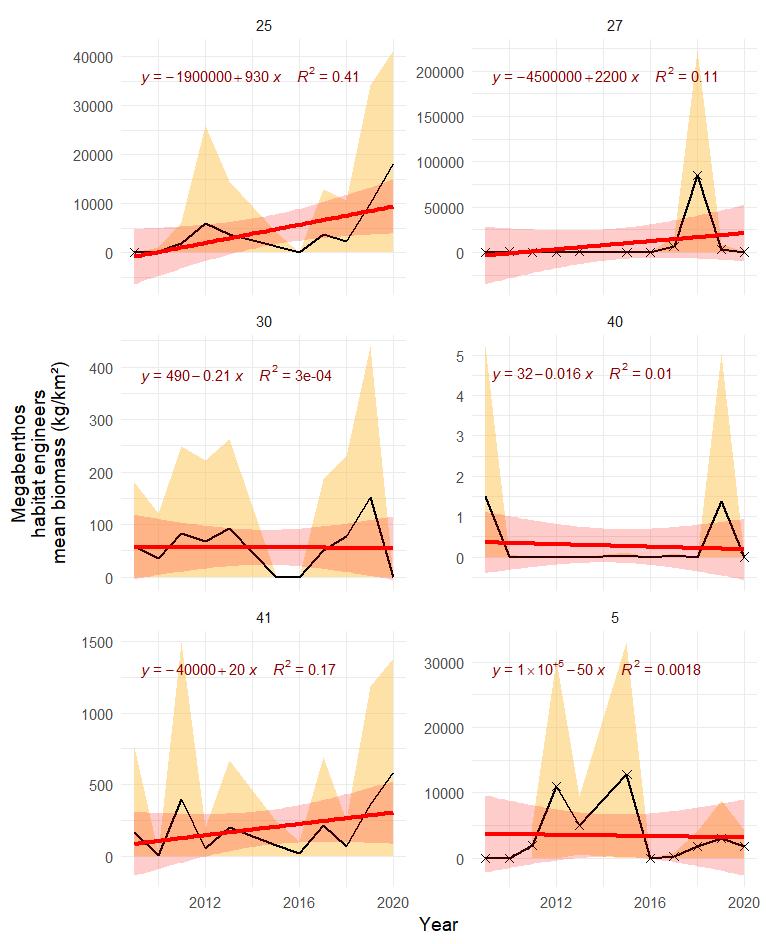
Figure S. 13.1 Mean (± sd) biomass / km2 of megabenthic habitat engineers in each polygon in the subarctic part of the Barents Sea. Stars denote years with low sample size (< 5 trawls). The red line represents fitted trend of degree 1 (with 95 th confidence interval)