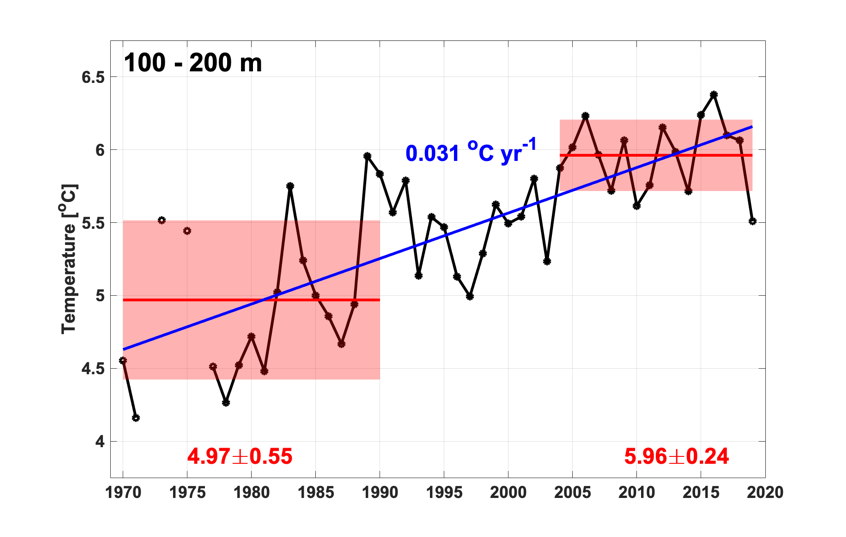
Figure S.32.3 Mean temperature between 100 and 200 meters. Means and standard deviations for 1970-1990 and 2004-2019 are shown by red lines and pale red boxes with actual shown in red. Linear trends 1970-2019 and 2004-2019 are shown in blue when statistically significant at the 95% level (with actual values also in blue).