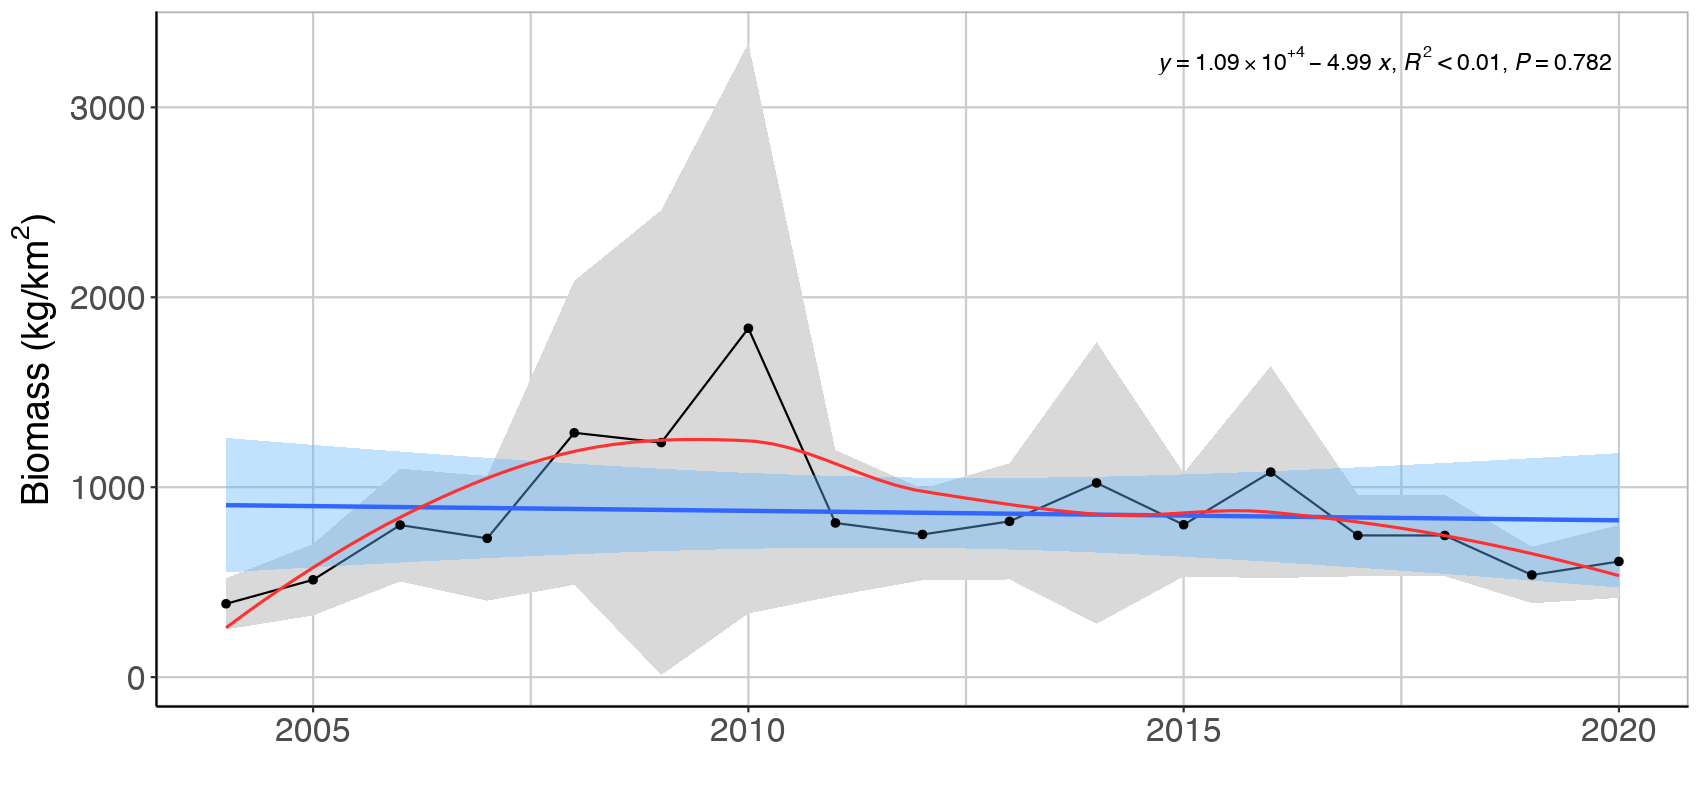
Figure A. 1.4. Mean (± 2*SE) biomass of planktivorous (A) and benthivorous (B) feeding guilds in bottom trawl catches in the Arctic part of the Barents Sea (Black dots and grey shading). Linear regression fit with 95% CI is shown in blue, and the statistical results are given in the top of each plot. A local smoother is added in red to assist visual interpretation of non-linear changes during the period