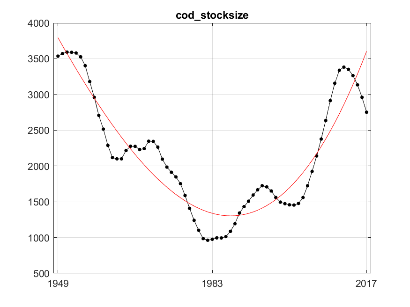
Figure A.24.1 The black dots and line are the indicator values of eight year running average of annual total stock biomass of NEA cod (in 1000 tonnes). The red line represents fitted trend of degree 3 (cubic). After fitting, residuals variance was 90780.83, R²=0.86.