Gå til hovedinnhold
Havforskningsinstituttet
HI
English
<- Tilbake
Søk
Søk
Søk
View page in English
Figur
Fra rapporten:
Panel-based Assessment of Ecosystem Condition of Norwegian Barents Sea Shelf Ecosystems - Appendices
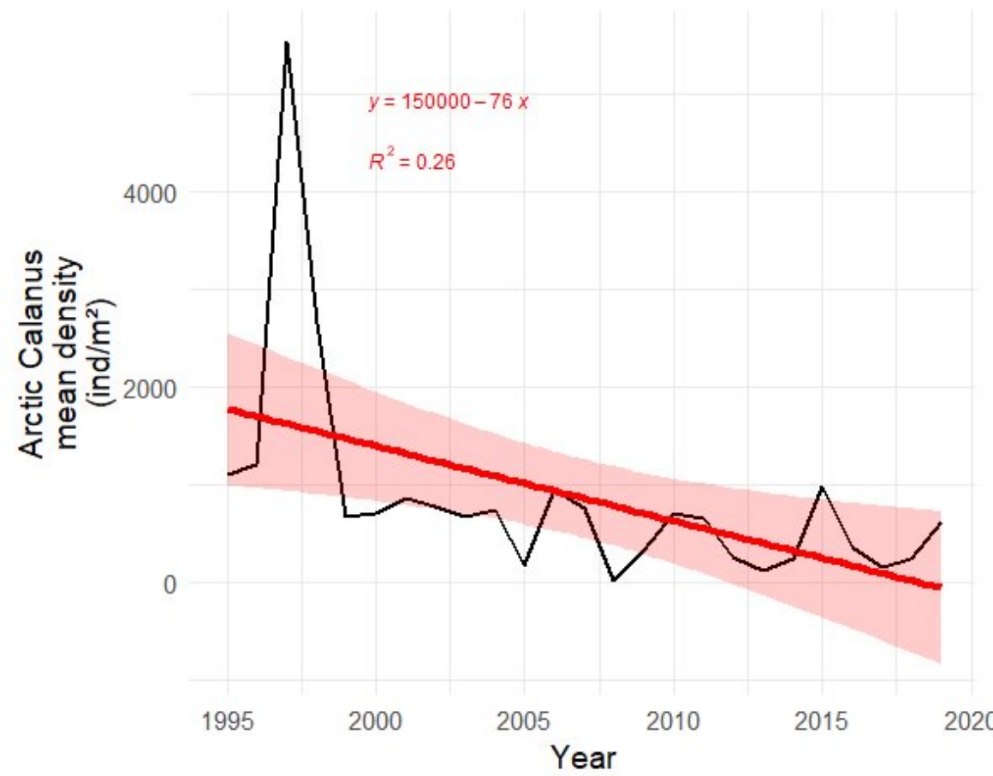
Figure S. 19.1. The time series of estimated abundance of Arctic Calanus species (ind. m-2). Red line and shaded areas indicate fitted linear trend and 95% confidence band, with equation and R² indicated in red.