Gå til hovedinnhold
Havforskningsinstituttet
HI
English
<- Tilbake
Søk
Søk
Søk
View page in English
Figur
Fra rapporten:
Panel-based Assessment of Ecosystem Condition of Norwegian Barents Sea Shelf Ecosystems - Appendices
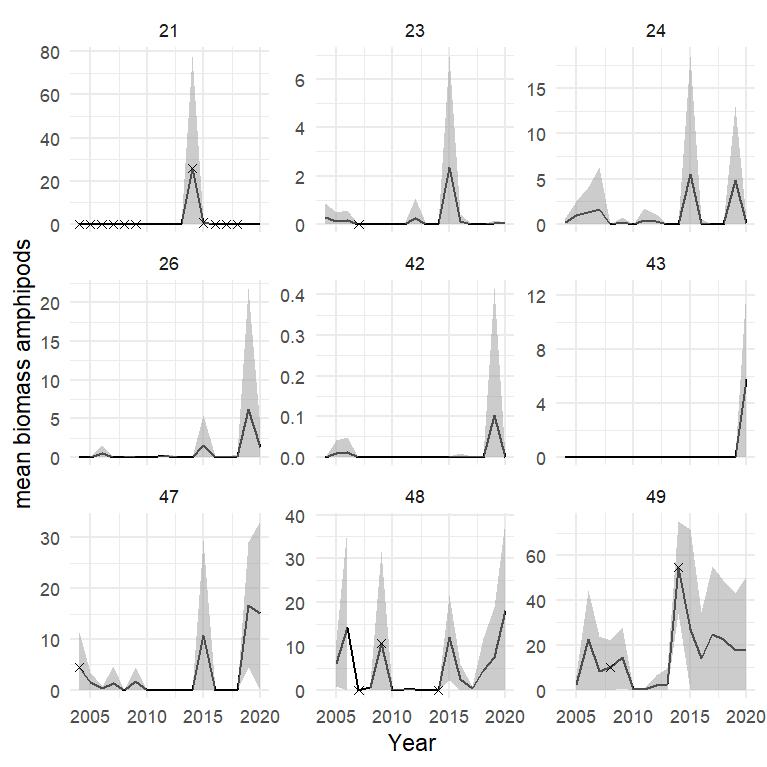
Figure A.13.6 Mean (± sd) biomass / km2 of pelagic amphipods in each polygon in the Arctic part of the Barents Sea. Stars denote years with low sample size (< 5 trawls).