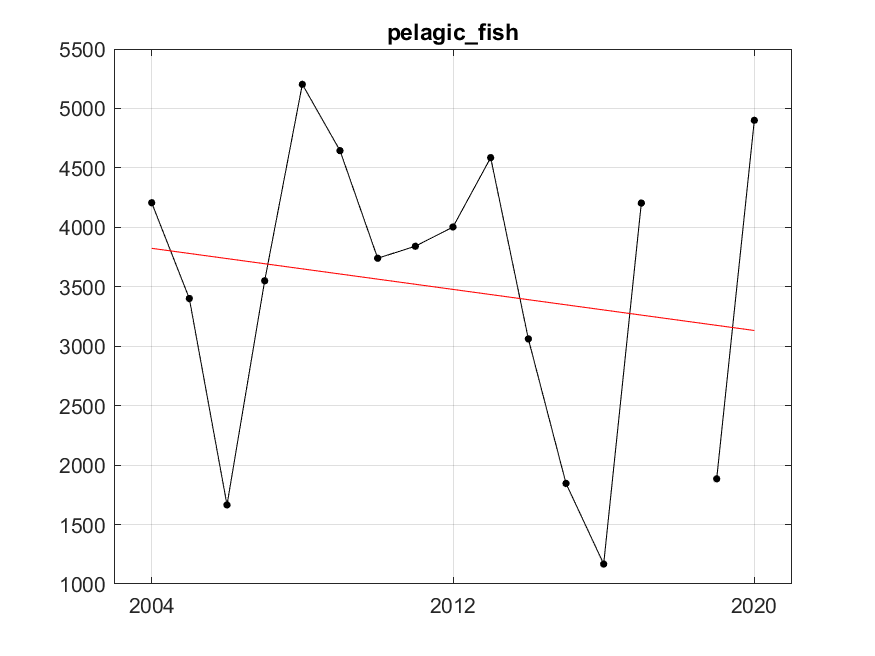
Figure S.7.1 The black dots and line are the indicator values of the sum of annual total stock biomass of herring, capelin and blue whiting. The red line represents fitted trend of degree 1 (linear). After fitting, residuals variance was 1495980.00, R²=0.03.