Gå til hovedinnhold
Havforskningsinstituttet
HI
English
<- Tilbake
Søk
Søk
Søk
View page in English
Figur
Fra rapporten:
Panel-based Assessment of Ecosystem Condition of Norwegian Barents Sea Shelf Ecosystems - Appendices
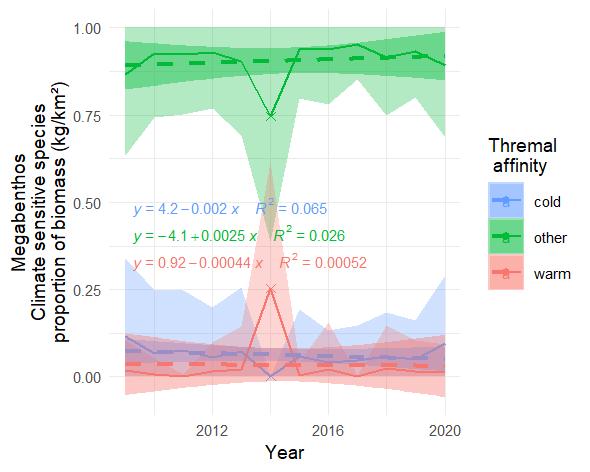
Figure A.30.2 Proportion of mean (± sd) biomass / km2 of climate sensitive megabenthos in the Arctic part of the Barents Sea. The dotted lines represents fitted trend of degree 1 (with 95% confidence intervals).