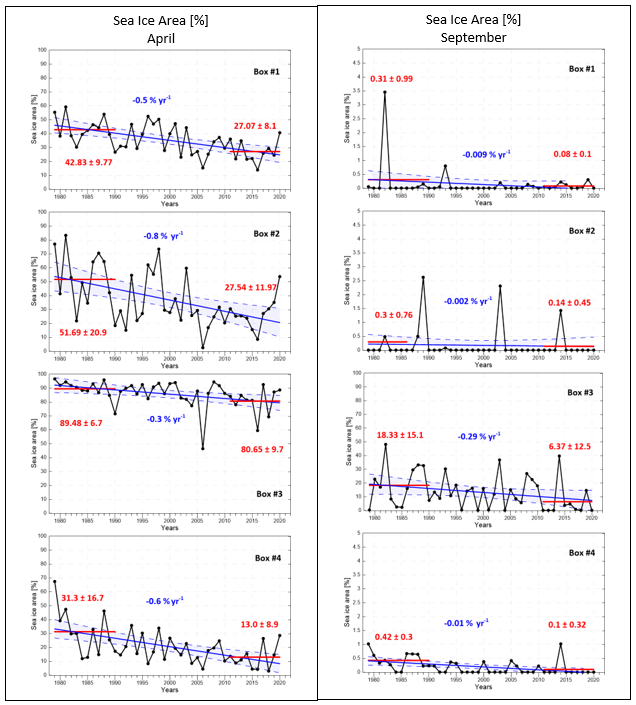
Figure A.28.3 Interannual variability of sea ice area (%) in boxes covering selected polygons for 1979-2020 in April (left) and September (right). Linear trends (blue lines) with 95% confidence intervals (blue shading) are shown (with actual values also in blue). Means and standard deviations for the periods of 1979-1990 and 2011-2020 are shown by red lines with actual values also in red. Note that due to generally low levels of sea ice area in the boxes 1, 2 and 4 in September, the vertical axis is scaled here from 0 to 5% in order to visualize changes.