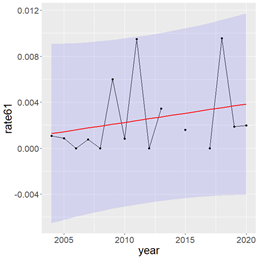
Figure S.30.1 Sighting rate of killer whales (A), white-beaked dolphins (B), harbour porpoises (C), and sperm whales (D) during BESS surveys from 2004.2020. The red lines represent fitted trends with R2 of 0.063, 0.024, 0.13, and 0.067, respectively. The blue bands are 95% confidence intervals.