Gå til hovedinnhold
Havforskningsinstituttet
HI
English
<- Tilbake
Søk
Søk
Søk
View page in English
Figur
Fra rapporten:
Panel-based Assessment of Ecosystem Condition of Norwegian Barents Sea Shelf Ecosystems - Appendices
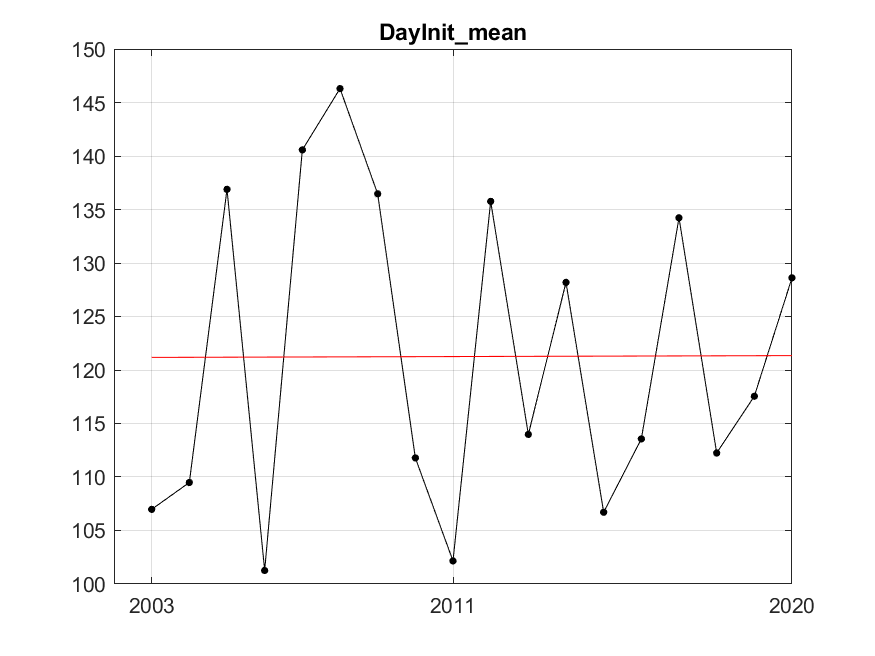
Figure S.2.2 Estimated date for start of the spring bloom and fitted trend using the best fitted trend approach represented by the red line. The fitted trend is of degree 1 (linear) with R²=0.00001. Residual variance after fitting was 210.10.