Gå til hovedinnhold
Havforskningsinstituttet
HI
English
<- Tilbake
Søk
Søk
Søk
View page in English
Figur
Fra rapporten:
Panel-based Assessment of Ecosystem Condition of Norwegian Barents Sea Shelf Ecosystems - Appendices
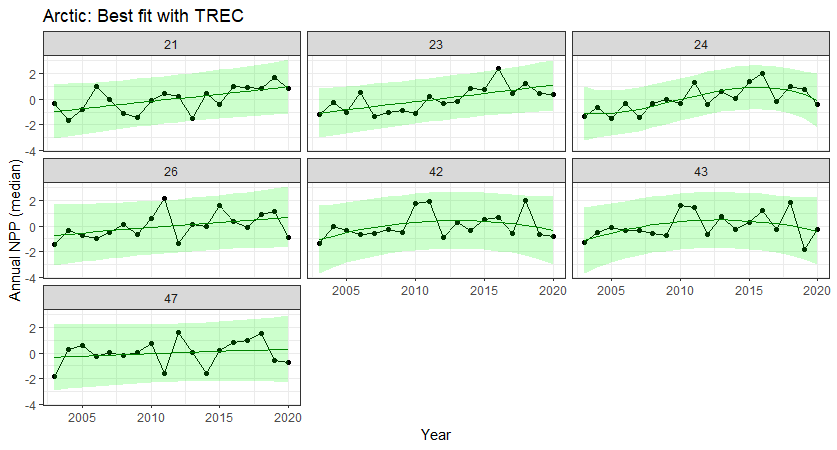
Figure A.1.2 Annual Primary production in each polygon in the Arctic part of the Barents Sea. Green line and shaded areas indicate fitted trend and 95% prediction bands from TREC analyses.