Gå til hovedinnhold
Havforskningsinstituttet
HI
English
<- Tilbake
Søk
Søk
Søk
View page in English
Figur
Fra rapporten:
Panel-based Assessment of Ecosystem Condition of Norwegian Barents Sea Shelf Ecosystems - Appendices
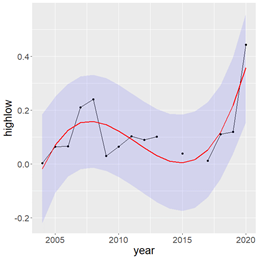
Figure S. 18.1 The ratio of the sighting rate of high to low trophic level marine mammals sighted during BESS surveys from 2004-2020. The red line represents a fitted trend (R 2 = 0.68), and the blue bands are 95% confidence intervals.