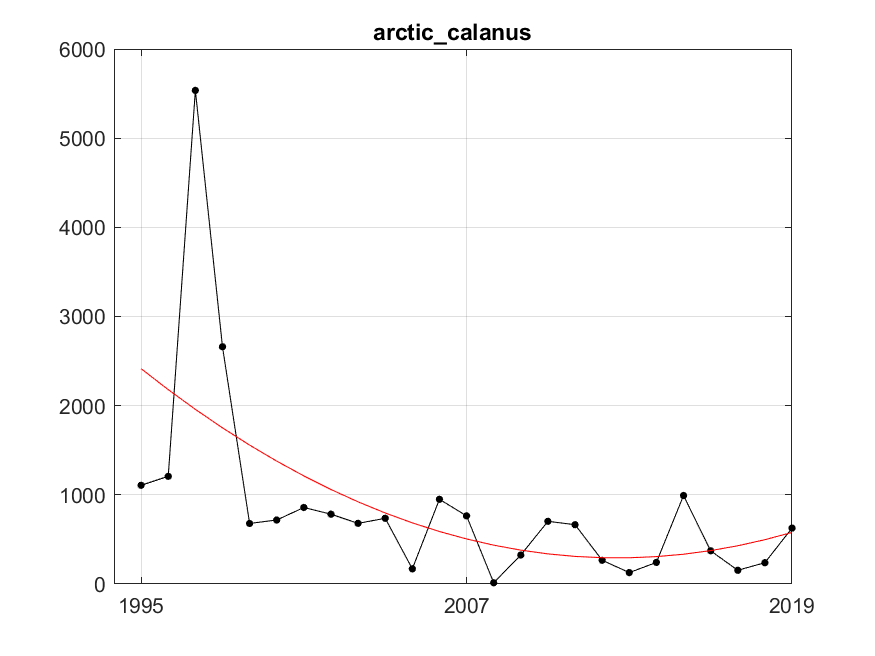
Figure S.19.2. Estimated abundance of Arctic Calanus species (ind. m -2) and fitted trend using the best fitted trend approach represented by the red line. The fitted line is of degree 2 (quadratic) with R²=0.35. Residual variance after fitting was 802706.30.