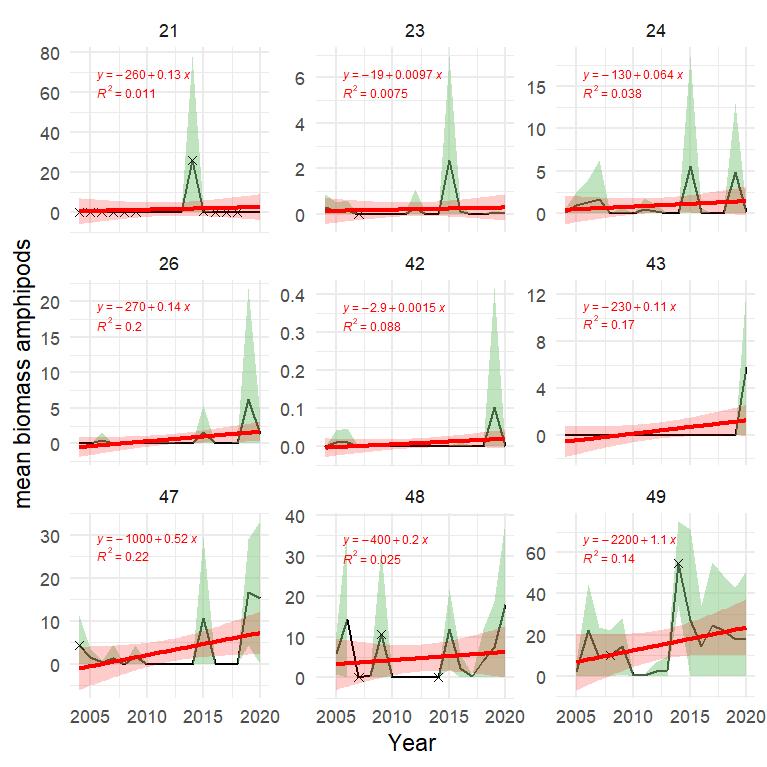
Figure A.13.3 Mean biomass of pelagic amphipods (kg/km² wet wt.) in each polygon in the Arctic part of the Barents Sea with 1± SD with green shaded areas. Red line and red shaded areas indicate fitted linear trend and 95% confidence bands, with equation and R² indicated in red Stars denote years with low sample size (< 5 trawls).