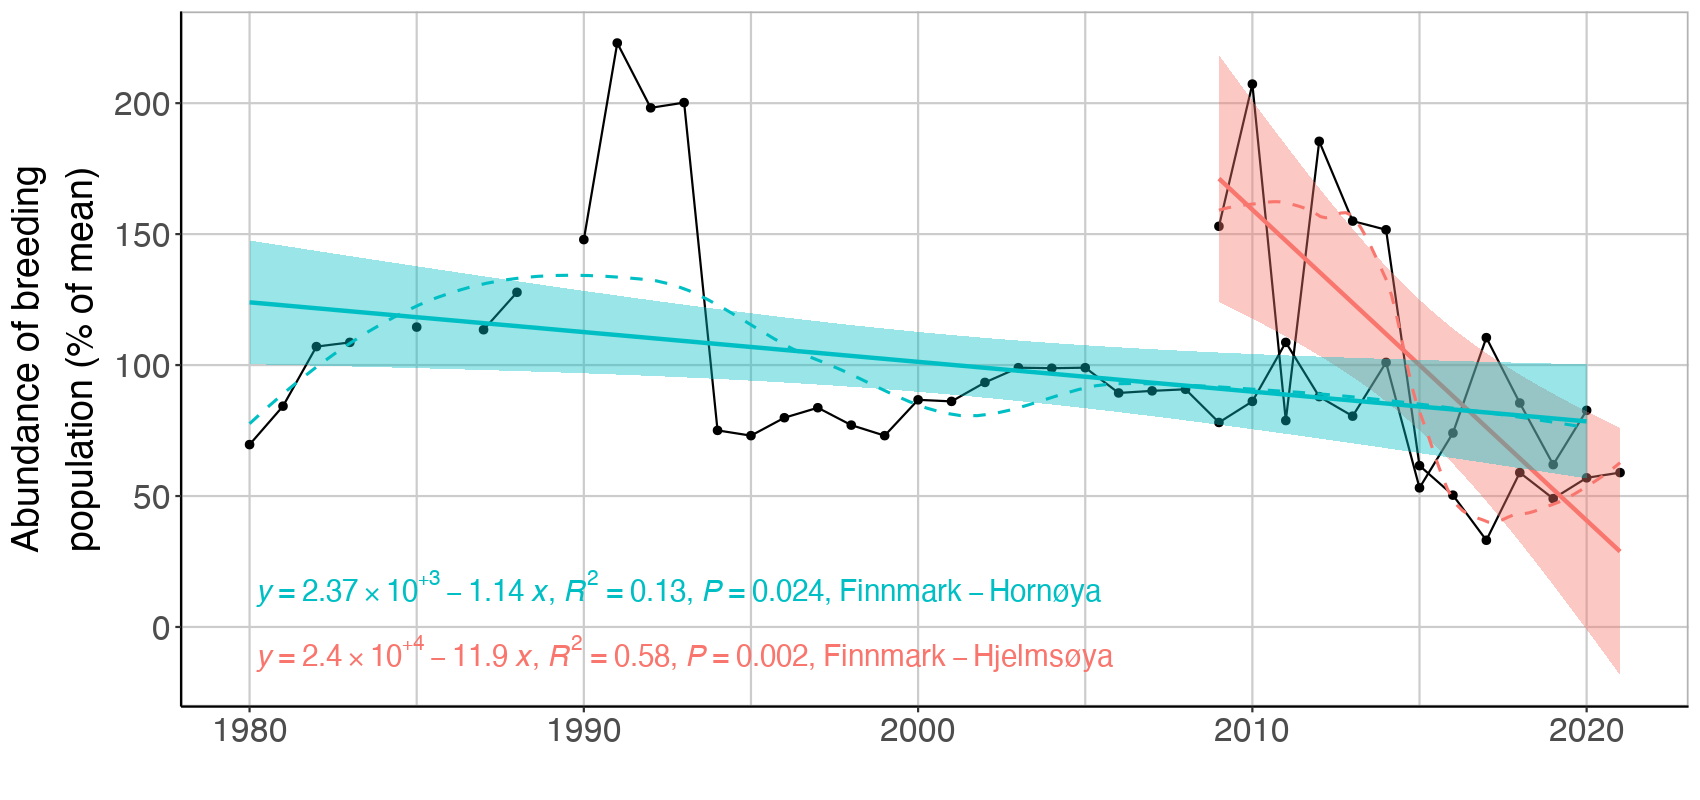
Figure S.8.3 Breeding population size of puffin (F. arctica) in colonies in Finnmark. Linear regression fit with 95% CI is shown as solid lines, and the statistical results are given at the bottom of the plot. A local smoother is added as stippled lines to assist visual interpretation of non-linear changes during the period.