Gå til hovedinnhold
Havforskningsinstituttet
HI
English
<- Tilbake
Søk
Søk
Søk
View page in English
Figur
Fra rapporten:
Panel-based Assessment of Ecosystem Condition of Norwegian Barents Sea Shelf Ecosystems - Appendices
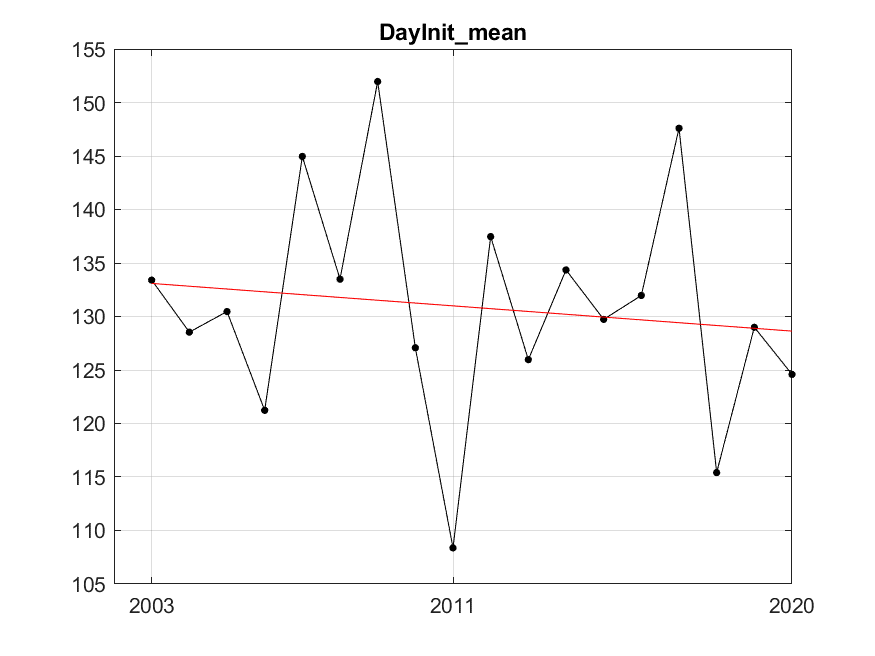
Figure A.2.2 Estimated start date of the spring bloom and fitted trend using the best fitted trend approach represented by the red line. The fitted trend is of degree 1 (linear) with R²=0.02. After fitting, residuals variance was 110.94.