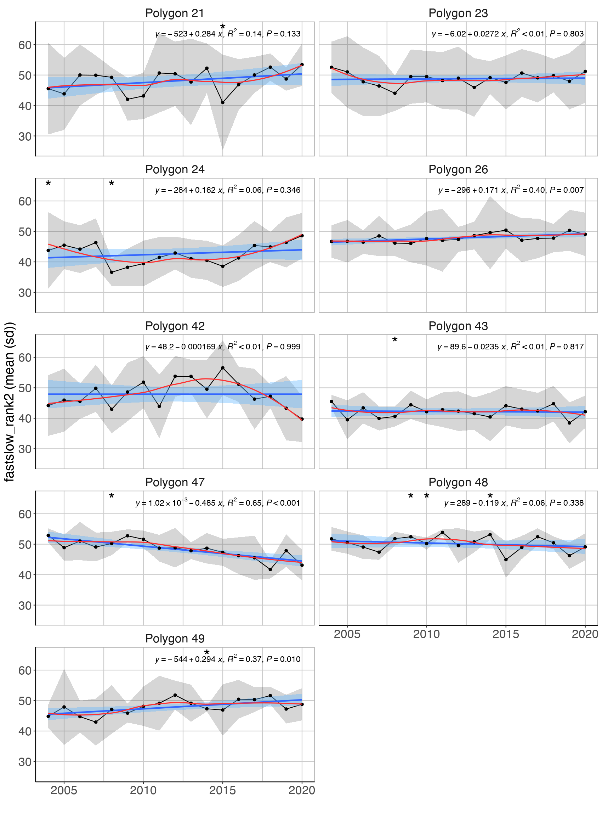
Figure A.16.2 Mean (± sd) biomass weighted fast-slow life history rank value in the Arctic part of the Barents Sea (Black dots and grey shading). High values translate to slow life history strategy. Linear regression fit with 95% CI is shown in blue, and the statistical results are given in the top of each plot. A local smoother is added in red to assist visual interpretation of non-linear changes during the period. Stars denote years with low sample size (< 5 trawls). A) in the whole area. B) per polygons.