Gå til hovedinnhold
Havforskningsinstituttet
HI
English
<- Tilbake
Søk
Søk
Søk
View page in English
Figur
Fra rapporten:
Panel-based Assessment of Ecosystem Condition of Norwegian Barents Sea Shelf Ecosystems - Appendices
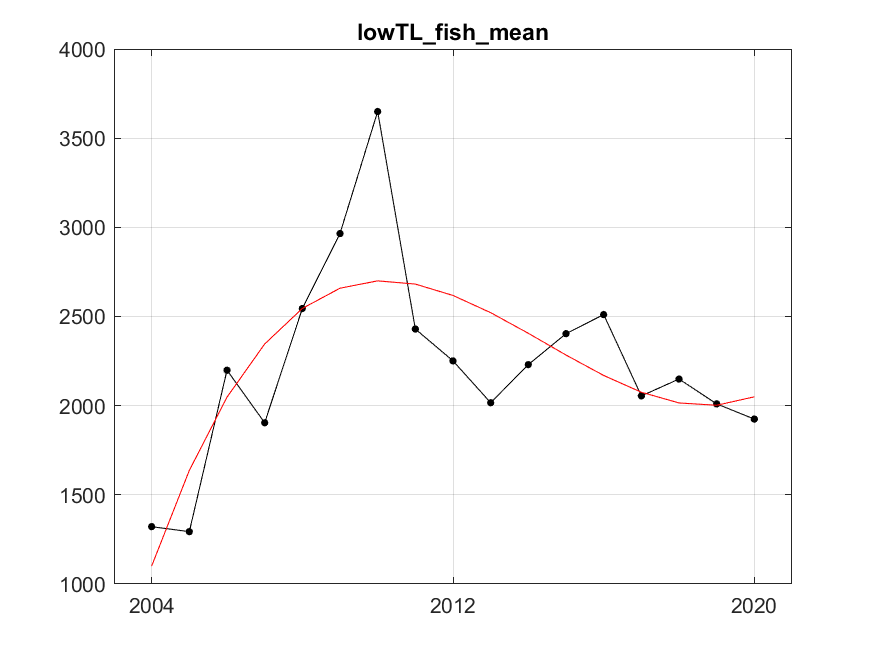
Figure A.1. 2 The red line represents fitted trend of degree 3 (cubic). After fitting, residuals variance was 126832.50, R²=0.58.