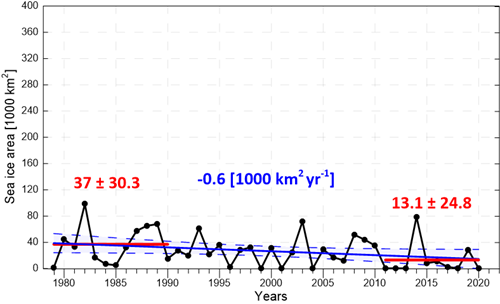
Figure A.28.2 Interannual variability of sea-ice area in a box (81.65-73.64°N; 8.21-38.0°E) covering all selected polygons for the period of 1979-2020 in September. Linear trend (blue line) with 95% confidence intervals (blue shading) with R 2 = 0.08 is shown (with actual values also inblue). Means and standard deviations for the periods of 1979-1990 and 2011-2020 are shown by red lines with actual values in red, in 1000 km2 yr-1.