Gå til hovedinnhold
Havforskningsinstituttet
HI
English
<- Tilbake
Søk
Søk
Søk
View page in English
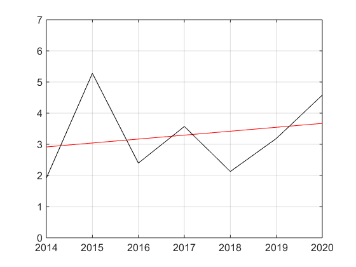
Figur
Fra rapporten:
Panel-based Assessment of Ecosystem Condition of Norwegian Barents Sea Shelf Ecosystems - Appendices
Figure A.29.2 Themisto libellula time series and fitted trend represented by the red line. The fitted trend is of degree 1 (linear) with R²=0.05. Residual variance after fitting was 1.55.