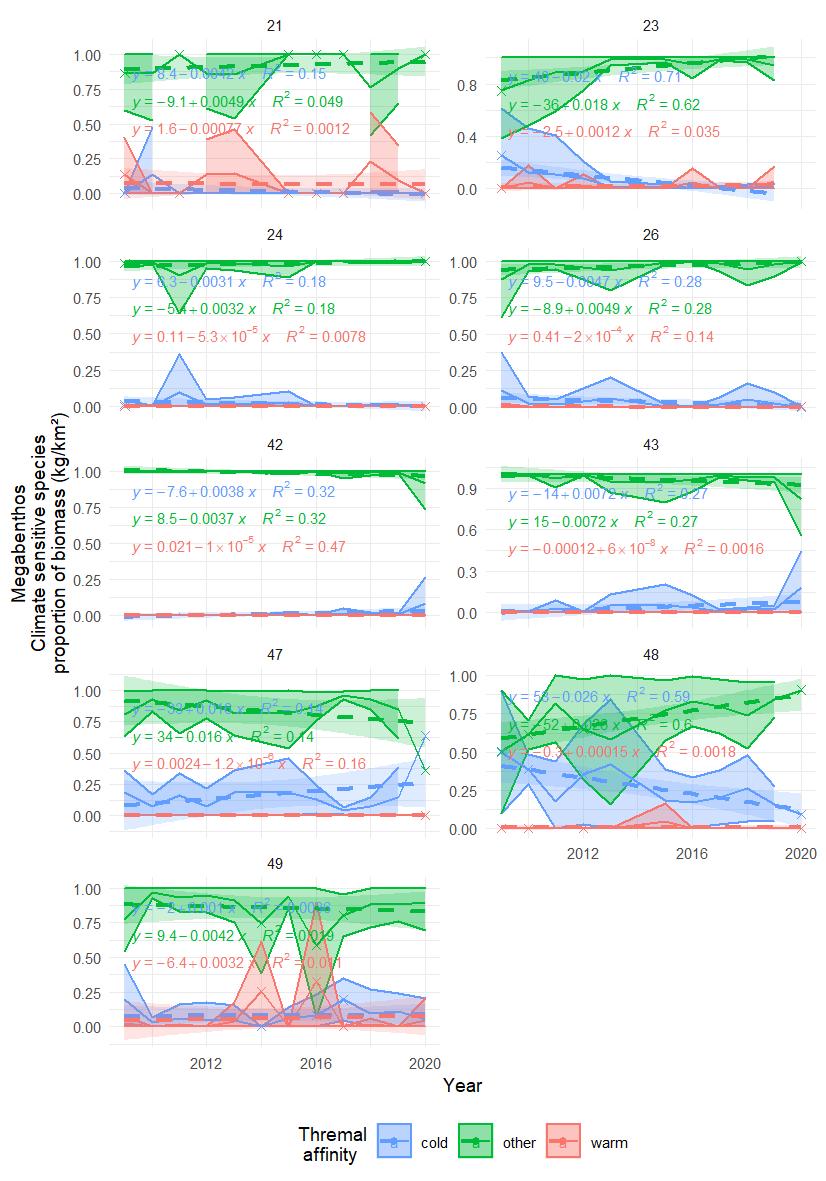
Figure A. 30.1 Proportion of mean (± sd) biomass / km2 of climate sensitive megabenthos in each polygon in the Arctic part of the Barents Sea. Stars denote years with low sample size (< 5 trawls). The dotted lines represent fitted trend of degree 1 (with 95% confidence intervals).