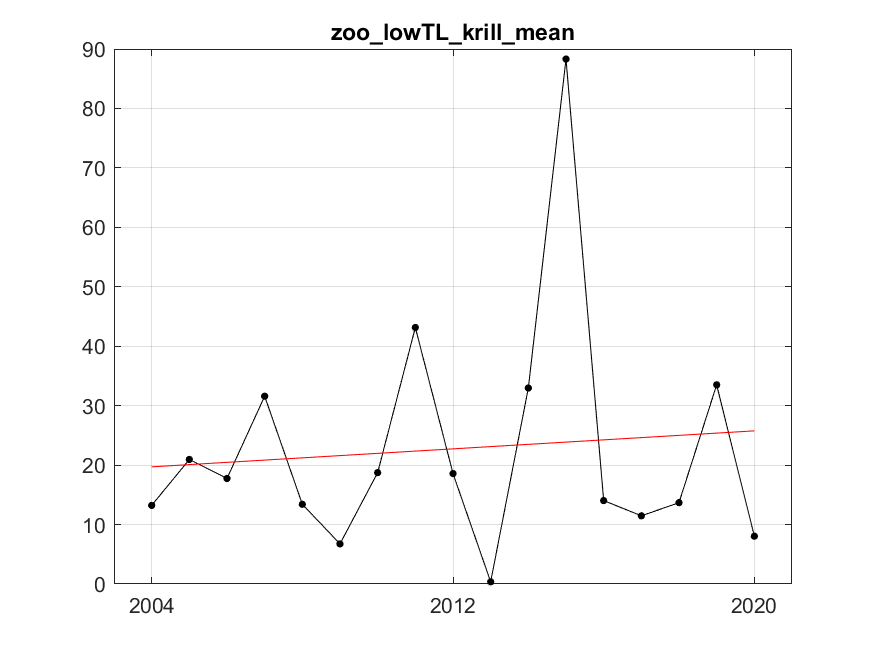
Figure A.3.2. Estimated low trophic level krill biomass (Kg km2 wet wt) and fitted trend using the best fitted trend approach represented by the red line. The fitted trend is of degree 1 (linear) with R²=0.01. Residual variance after fitting was 403.42.