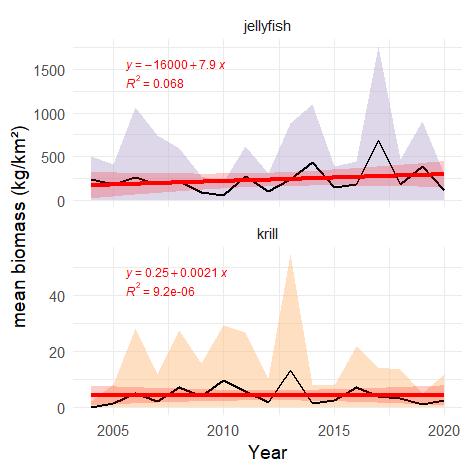
Figure S.4.1. The time series of estimated mean biomass (kg wet wt. km-2) of high trophic level zooplankton (carnivorous Meganyctiphanes norvegica and gelatinous zooplankton (mainly dominated by Cyanea spp.) shown with grey (jellyfish) and yellow (krill) shaded areas indicating ± 1 SD. Red line and red shaded areas indicate fitted linear trend and 95% confidence interval, with equation and R² indicated in red.