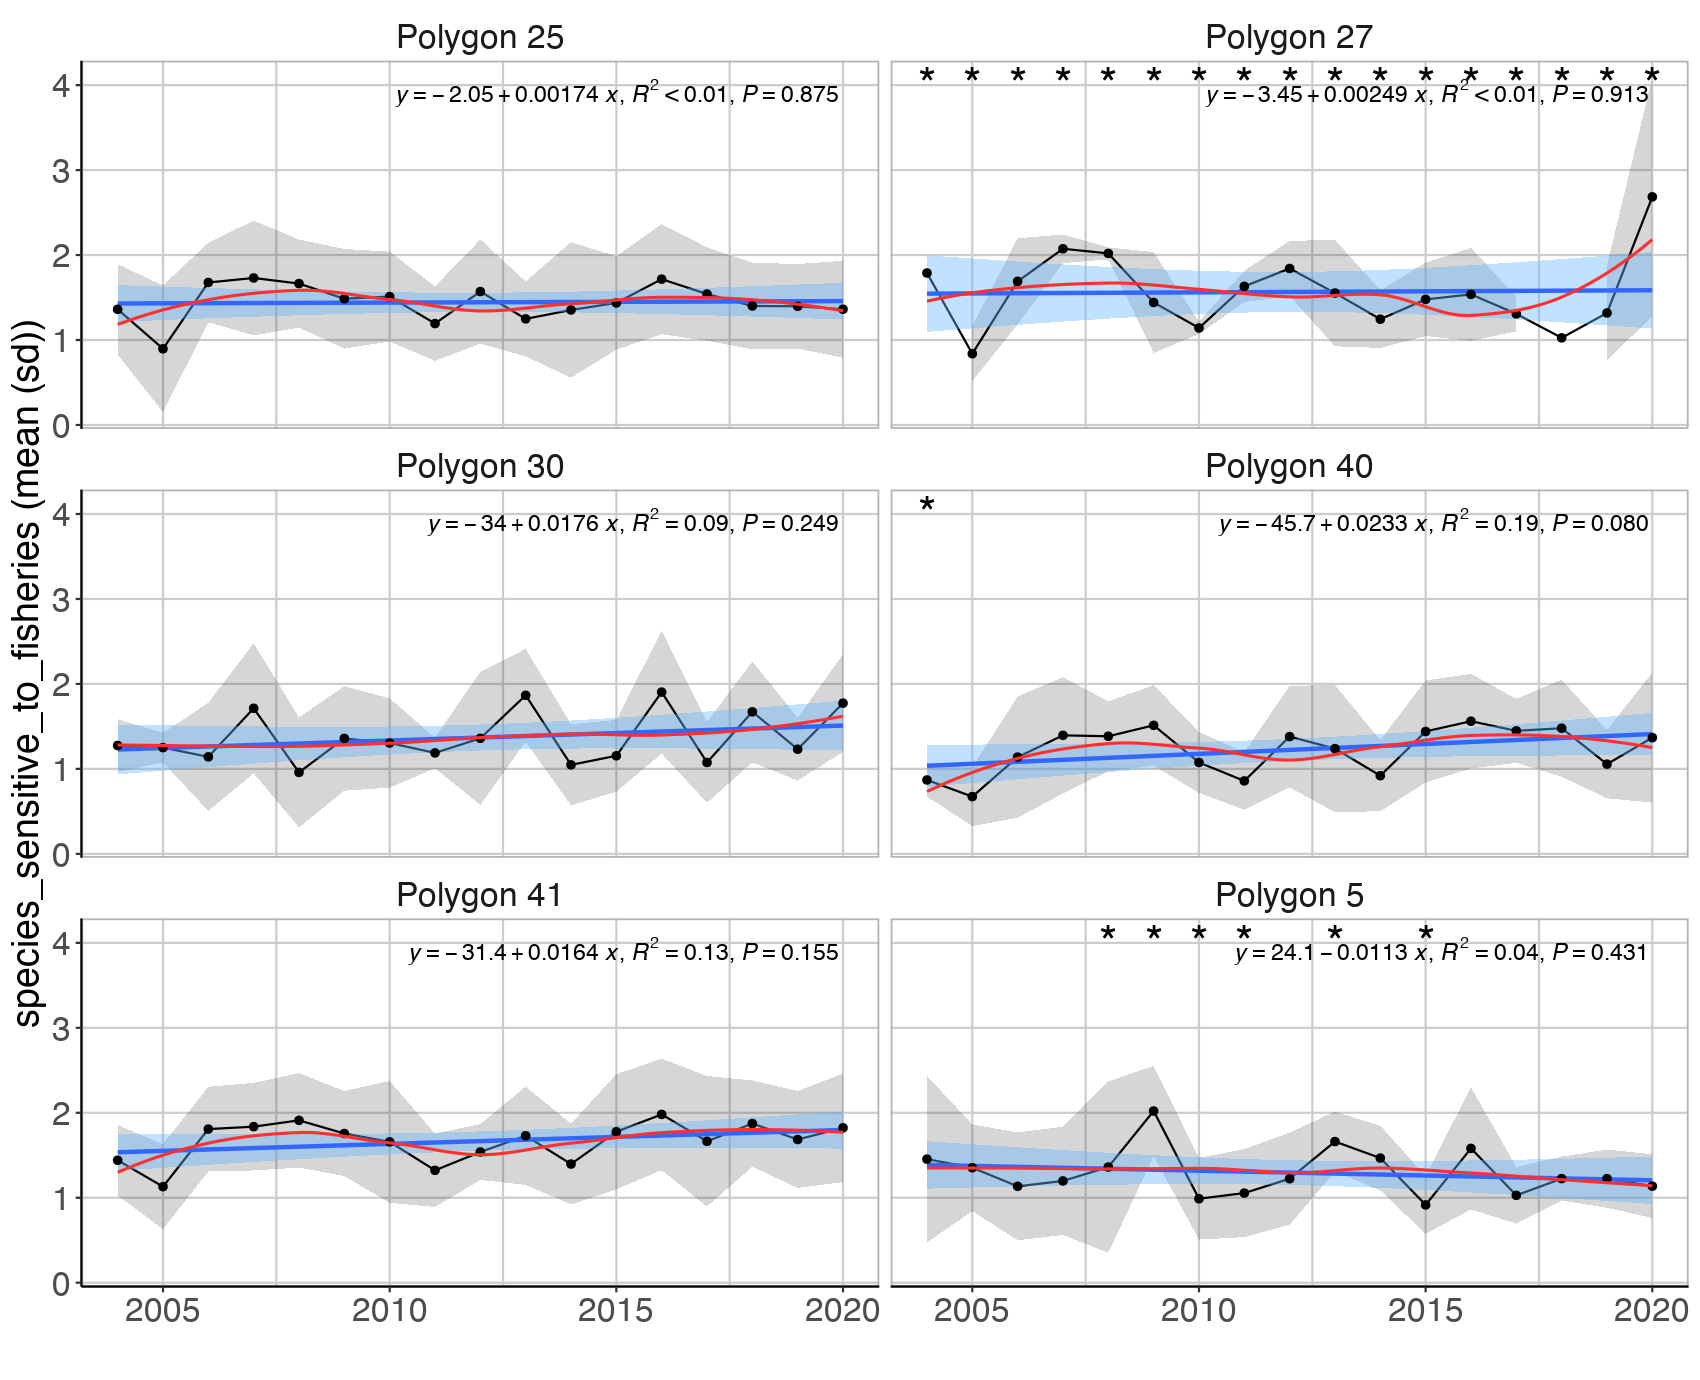
Figure S.29.1 Mean (± sd) of the sum of normalised log transformed abundances of fish species sensitive to fisheries in demersal trawls the Arctic Barents Sea (Black dots and grey shading). Linear regression fit with 95% CI is shown in blue, and the statistical results are given in the top of each plot. A local smoother is added in red to assist visual interpretation of non-linear changes during the period. Stars denote years with low sample size (< 5 trawls).