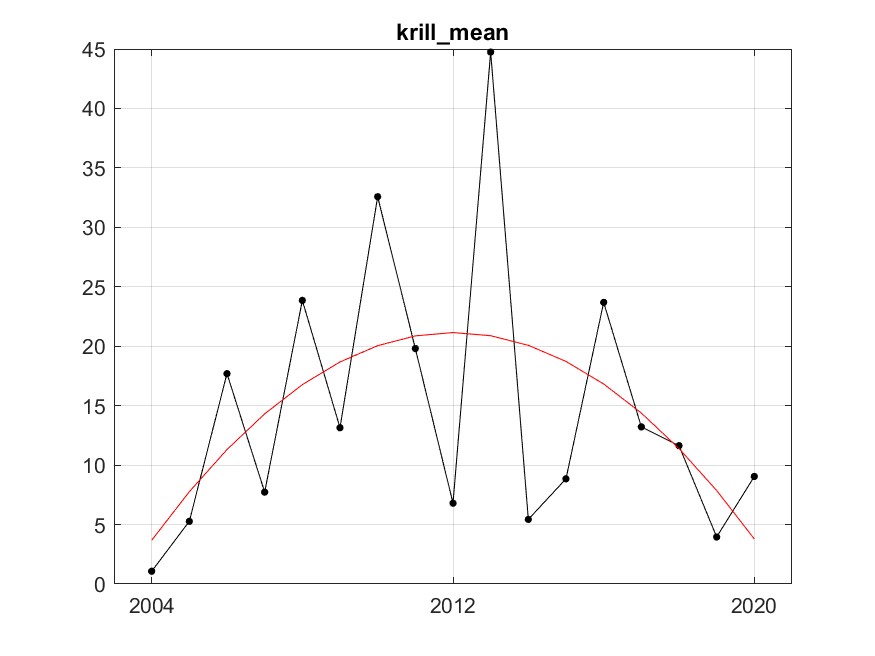
Figure S. 21.2. Estimated biomass of krill (kg wet wt. km-2) and fitted trend using the best fitted trend approach represented by the red line the red line. The fitted trend approach trend is of degree 2 (quadratic) with R²=0.27. Residual variation after fitting was 94.66.