Gå til hovedinnhold
Havforskningsinstituttet
HI
English
<- Tilbake
Søk
Søk
Søk
View page in English
Figur
Fra rapporten:
Panel-based Assessment of Ecosystem Condition of Norwegian Barents Sea Shelf Ecosystems - Appendices
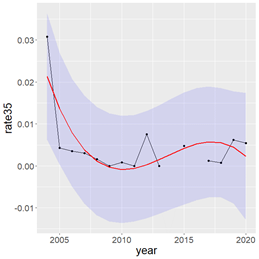
Figure A. 10.2. Sighting rate of minke whales (A) and humpback whales (B) during BESS surveys from 2004-2020. The red lines represent fitted trends with R 2 of. 0.21 and 0.61, respectively. The blue bands are 95% confidence intervals.