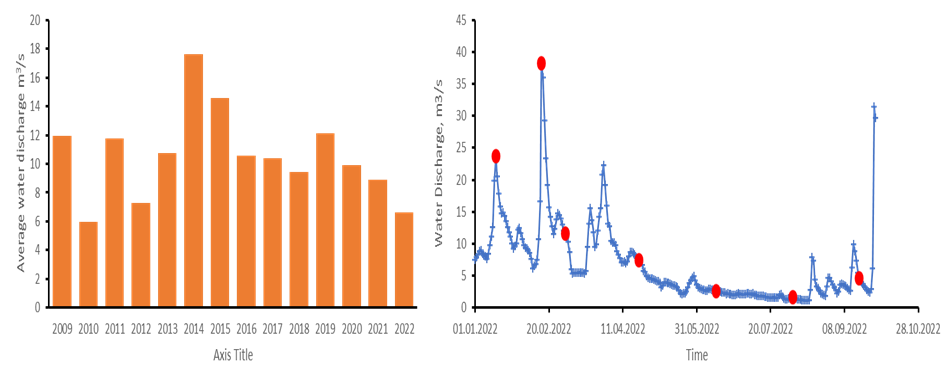
Figure 2. a) Yearly average of freshwater discharge measured by the Lundevannet sensor from 2009 to 2022. The average was calculated from January till September to in order to compare only the time frame considered by our study. b) 2022 water discharge based on the Lundevannet sensor. The red dots represent the day during which our samples were taken.