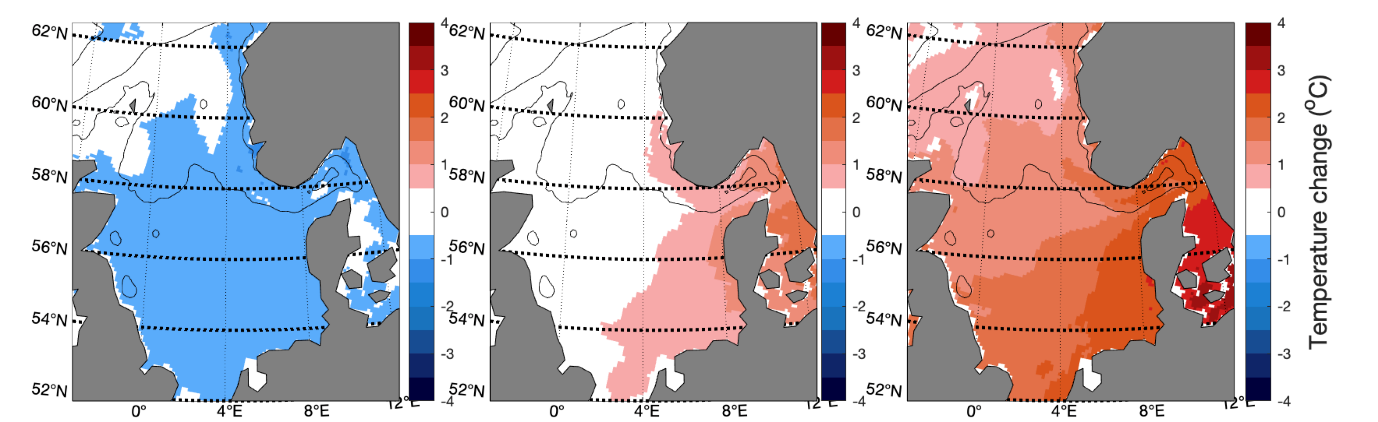
Figure 7.3.6 Projected change in temperature from 2015 to 2100 in the North Sea under three different emission scenarios, SSP1-2.6 (left panel), SSP2-4.5 (middle panel) and SSP5-8.5 (right panel). Projections are downscaled from the model NorESM2 using the regional ocean model NEMO NAA10km. Source: Anne Britt Sandø, Institute of Marine Research, personal communication.