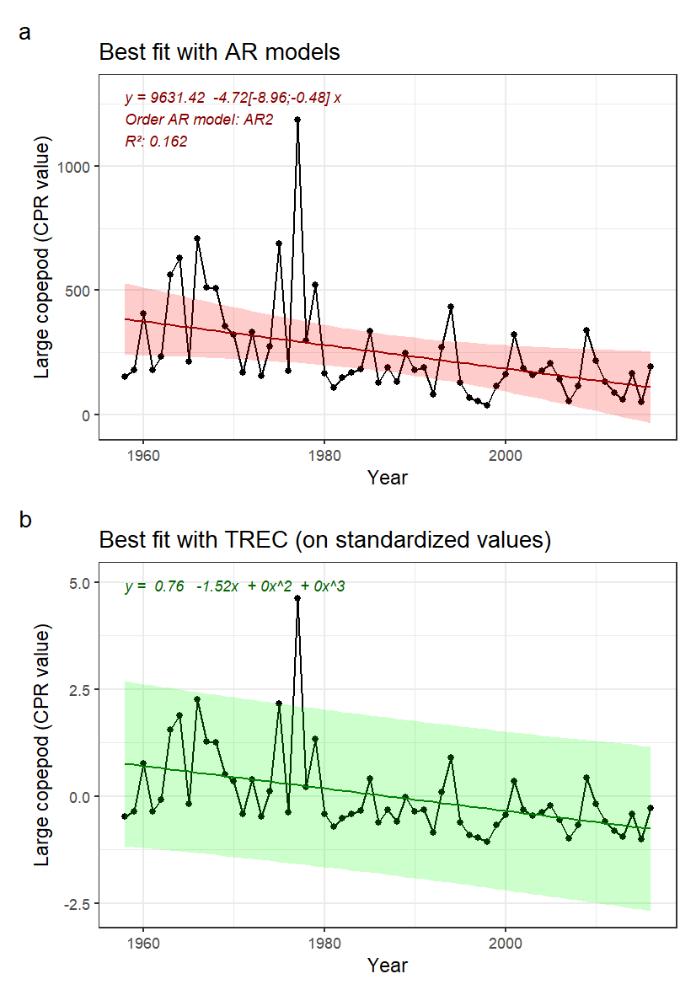
Figure 9.2: A) Indicator time series and best fitted trend with autoregressive model (AR0: no autoregression; AR1: 1st order autoregressive model, AR2: 2nd order autoregressive model, AR3: 3rd order autoregressive model). Numbers in brackets indicate the confidence interval (95%) around the slope coefficient and should not include 0 to be significative. B) Best fitted trend using the first steps of a TREC analysis on standardized time series