Gå til hovedinnhold
Havforskningsinstituttet
HI
English
<- Tilbake
Søk
Søk
Søk
View page in English
Figur
Fra rapporten:
Observed and expected future impacts of climate change on marine environment and ecosystems in the Nordic region
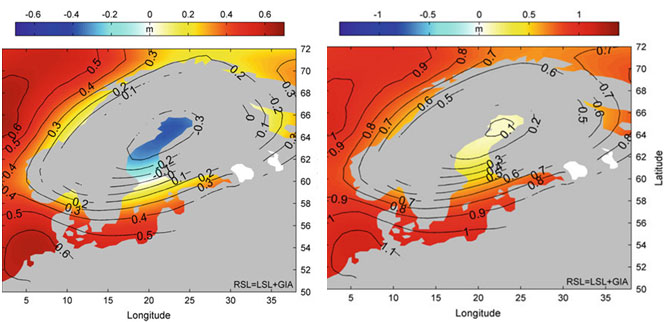
Figure 2. Projected relative changes in sea level from 1990-1999 to 2090-2099 for a moderate (left panel) and extreme (right panel) climate scenario. Information from Hill et al. (2010) and Grinsted et al. (2015).