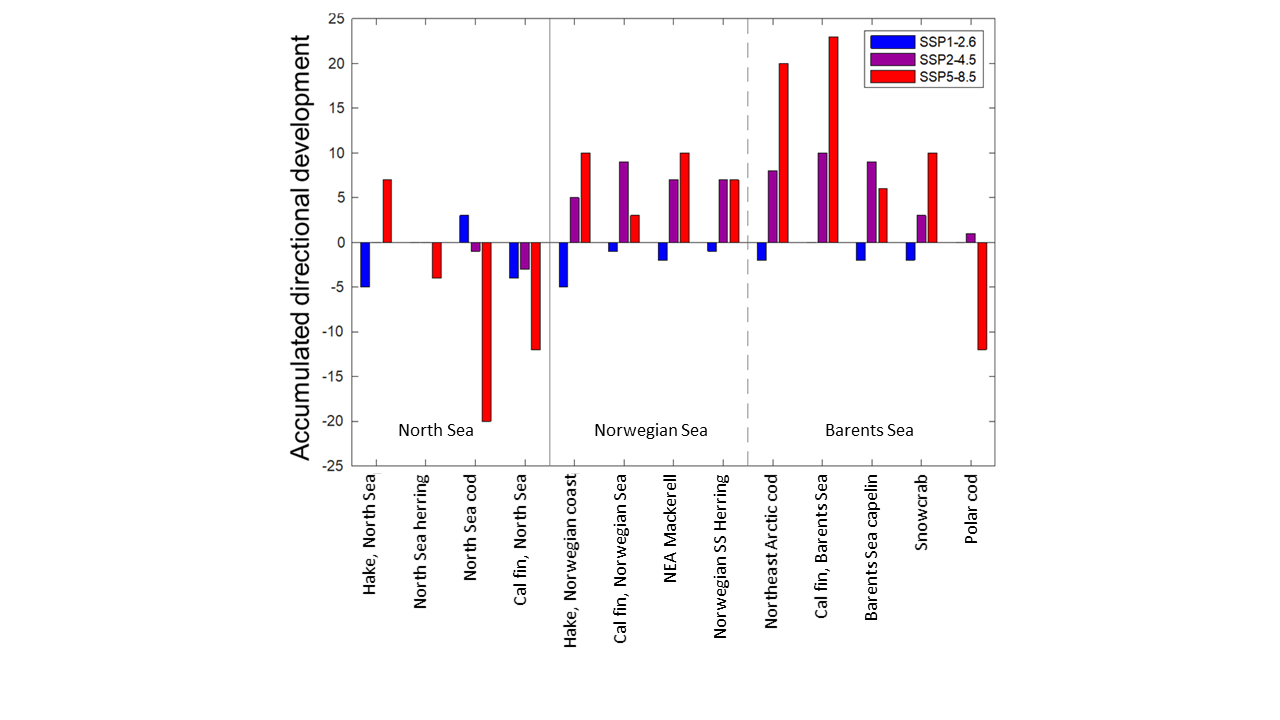
Figure 23. Accumulated directional development (relative scale) for populations in the North Sea (to the left of the vertical line), the Norwegian Sea (middle, between the full and stippled vertical lines) and the Barents Sea (right of the stippled vertical line). Colours represent anticipated development within the three climate emission scenarios SSP1-2.6, SSP2-4.5, and SSP5-8.5. Modified from Sandø et al. (2022).