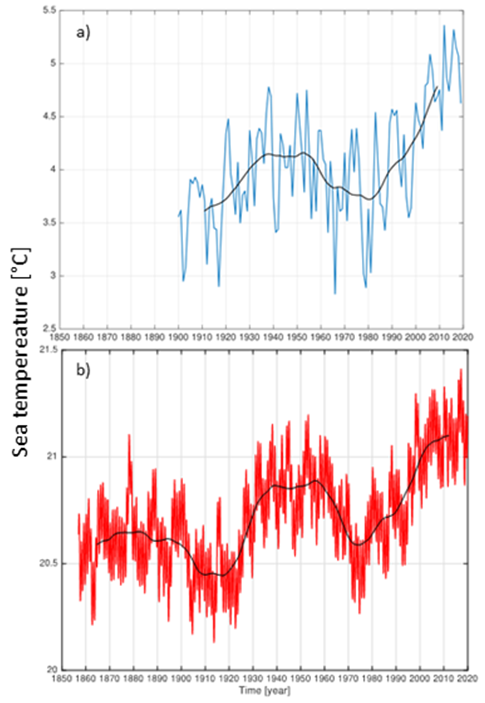
Figure 5. Temporal development of mean sea temperature in degrees Celsius in a) the upper 200 m along the Kola meridian transect in the south-central Barents Sea and b) in the upper 100 m of the Atlantic Ocean from the equator to the polar circle. Please note the difference in scale between the y-axes in a) and b). The temperature increase in the Barents Sea over the last decades is ca twice of that in the northern Atlantic. Adapted from work by Dr. Øystein Skagseth, IMR.