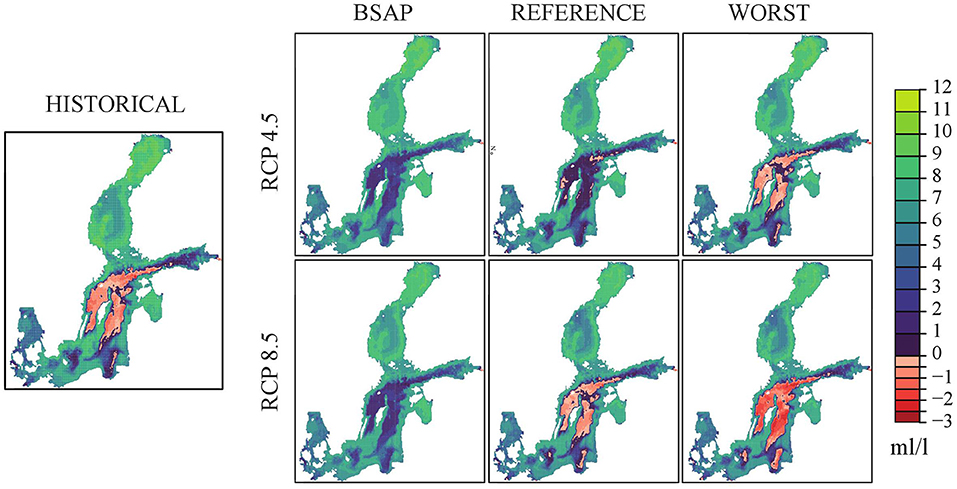
Figure 14. Historical (1976–2005) and projected future (2069–2098) ensemble mean summer bottom oxygen concentrations (in mL L −1 ) in three nutrient load (BSAP, Reference and Worst Case) and two greenhouse gas concentration scenarios (RCP 4.5 and 8.5). Hydrogen sulfide concentrations are represented by negative oxygen concentrations (1 mL H 2 S L −1 = −2 mL O 2 L −1 ). From Saraiva et al. (2019).