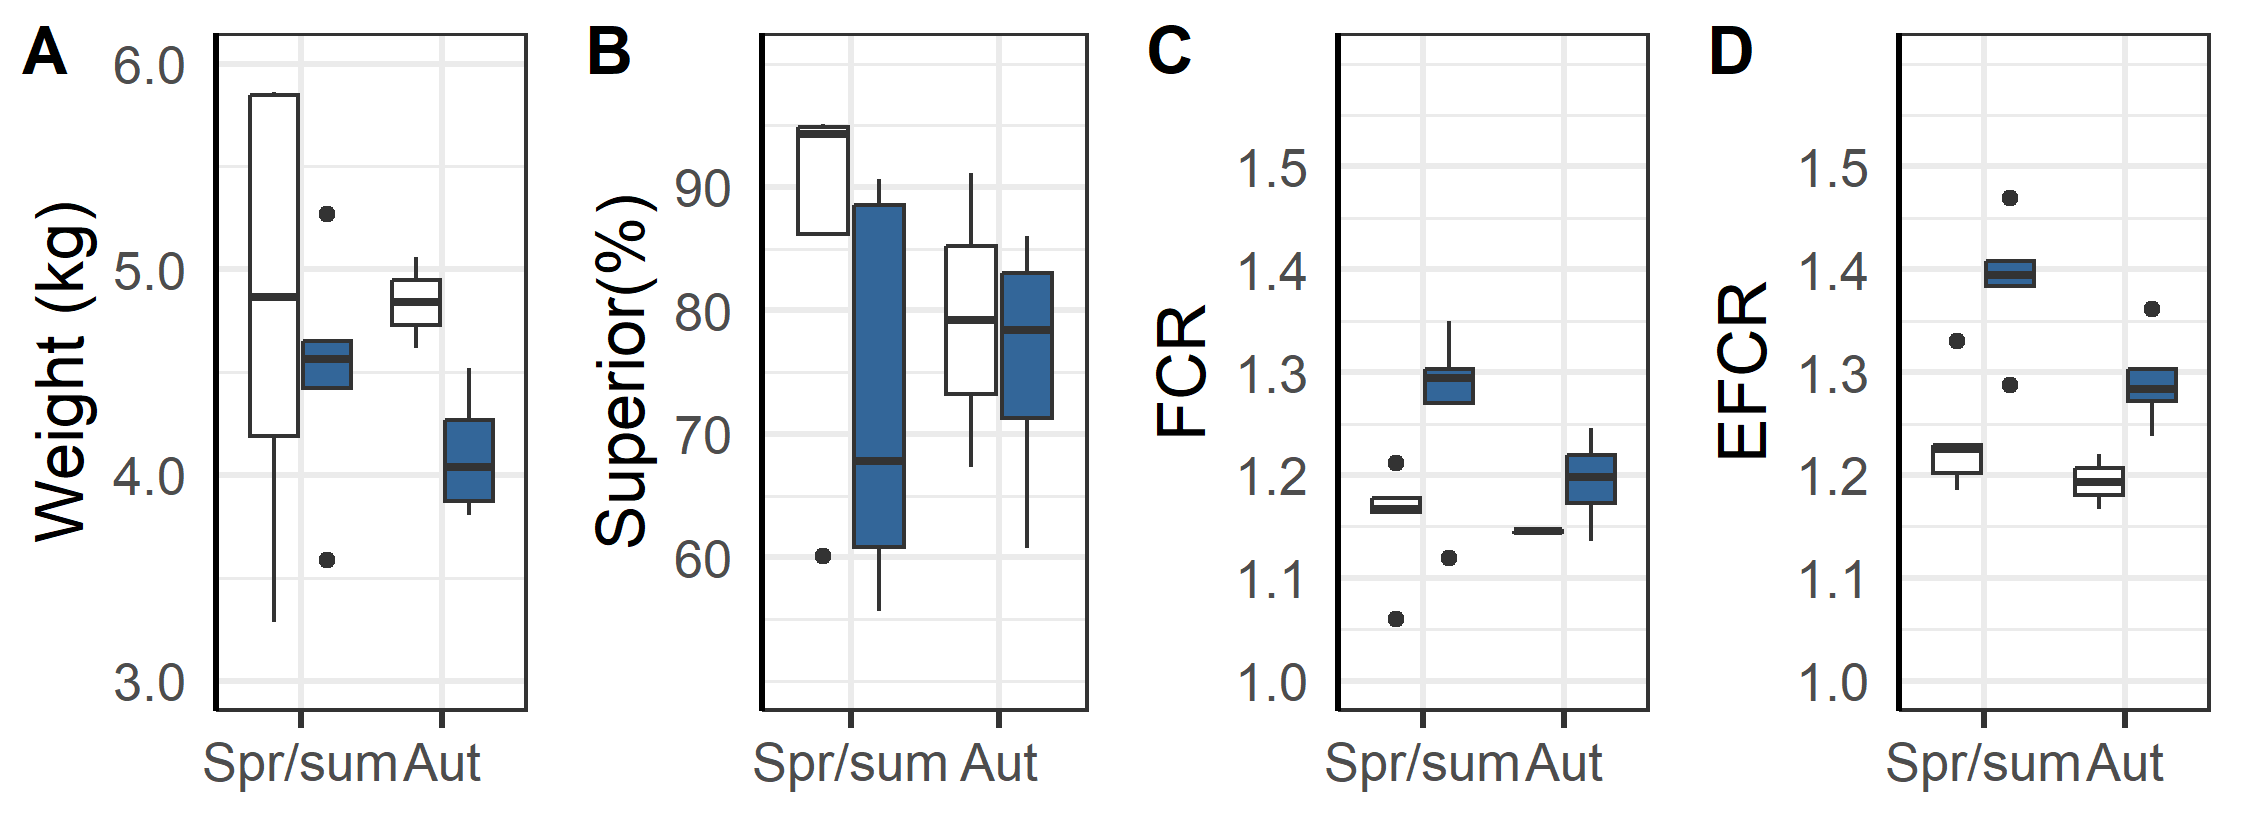
Figure 14: Mean weight at slaughter (A), mean percentage of the slaughtered fish classified as superior by the slaughterhouse (B), mean biological feed conversion ratio (C) and mean economic feed conversion ratio (D) for the diploid (white) and triploid (blue) groups of salmon originally transferred to sea in the spring/summer or in the autumn. Note that the cages that were destroyed are not included in these graphs.